Contents
What is Location Intelligence and Why is it Important for Restaurants?
Location Intelligence is an approach businesses use to gain insights from geospatial and location data. These insights help businesses identify patterns, make predictions, and build reliable projections. For restaurant businesses, Location Intelligence matters for three key reasons.- First, finding the best locations for expansion. Location Intelligence analyzes population density, foot traffic, purchasing power, and competitor distribution to determine which areas hold the most potential for attracting the right customers.
- Second, optimizing menus, products, and staffing. Every location comes with its own unique customer characteristics. Location Intelligence helps restaurants fine-tune their offerings and staffing levels based on the specific demands of each area.
- Third, projecting restaurant revenue. By analyzing demographic data, trade area coverage, and foot traffic patterns, businesses can build more accurate predictions of potential restaurant revenue.
Key Components of Location Intelligence for Restaurants
Now that you understand what Location Intelligence is and how it benefits restaurant businesses, the next question is: what kind of location data does it use to generate accurate revenue projections? Here are the main components:Foot Traffic Analysis
Foot traffic analysis measures the number of people entering or moving through a specific area or venue, such as a restaurant, retail store, or shopping center. This data is also commonly referred to as people traffic. In the restaurant business, foot traffic analysis serves four main purposes:- Measuring consumer engagement with a location
- Assessing sales potential based on visitor volume
- Optimizing staff scheduling during peak and off-peak hours
- Analyzing customer visit patterns over time
- Where visitors are coming from before they arrive
- How long they spend at the location
- Where they go after their visit
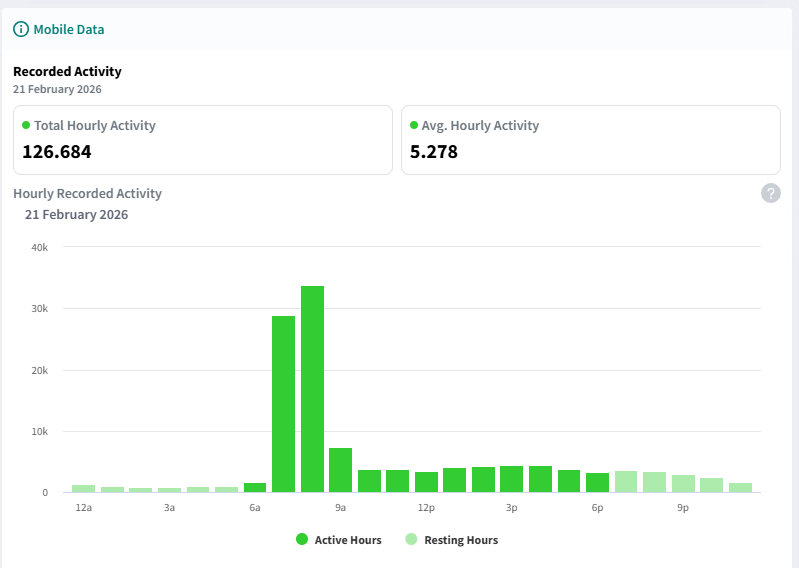 For example, mobile data from a popular Japanese restaurant in Gading Serpong on February 21, 2026, recorded a total daily activity of 126,684, averaging 5,278 activities per hour.
Peak foot traffic occurred between 7:00 and 9:00 a.m., with volumes reaching nearly 35,000 activities per hour. Traffic then dropped significantly around noon and remained relatively low throughout the afternoon and evening.
This data pattern allows restaurants to optimize operating hours and staffing more efficiently — for instance, by maximizing capacity during the busy morning rush and scaling back staff during the quieter evening hours.
For example, mobile data from a popular Japanese restaurant in Gading Serpong on February 21, 2026, recorded a total daily activity of 126,684, averaging 5,278 activities per hour.
Peak foot traffic occurred between 7:00 and 9:00 a.m., with volumes reaching nearly 35,000 activities per hour. Traffic then dropped significantly around noon and remained relatively low throughout the afternoon and evening.
This data pattern allows restaurants to optimize operating hours and staffing more efficiently — for instance, by maximizing capacity during the busy morning rush and scaling back staff during the quieter evening hours.
Catchment Area Analysis
So what exactly is a catchment area in the restaurant business? A catchment area, sometimes called a trade area or reach zone, refers to the geographic radius from which a single business location can realistically draw customers. In simple terms, it answers one key question: how far can a restaurant pull customers from its surrounding area? For example, a restaurant in the city center might have a catchment area of 2 km, meaning its potential customers include everyone living, working, or regularly active within that radius. That said, this figure isn’t fixed. Catchment area size depends heavily on how customers travel to the location, someone on foot will naturally come from a shorter distance than someone arriving by bicycle or motorbike. By understanding its catchment area, a restaurant can pinpoint:- The total potential population reachable from a single location
- Underserved areas worth considering for expansion
- Estimated revenue potential based on the size and spending characteristics of the population within the zone
Demographic Data and Purchasing Power
Demographic data and purchasing power are location factors that directly determine whether a restaurant’s target market actually exists in a given area, and whether that market has the ability and willingness to spend on what the restaurant offers. Demographic data includes information such as the age, gender, occupation, and education level of residents in an area. This data helps restaurant businesses answer one crucial question: does the population profile of this location actually match my target market? A family restaurant with an affordable menu will perform better in a densely populated residential area with a young demographic and growing families, while a fine dining restaurant is better suited to an area with a high-income professional profile. That said, demographics alone are not enough. Purchasing power is the next determining factor. Even if the right target market exists in a location, a mismatch between their spending capacity and the restaurant’s price point will cause revenue projections to fall short. This is why opening a premium restaurant in a low-purchasing-power neighborhood is a costly strategic mistake. Not because the product is bad, but because the market simply cannot support it. By integrating demographic and purchasing power data into Location Intelligence, restaurant businesses can project revenue more accurately and ensure that every location decision is grounded in a real match between what the business offers and who actually lives in the area. According to 2024 data from the Central Statistics Agency (BPS), the average monthly per capita expenditure on prepared food and beverages reached IDR 285,676 in urban areas and IDR 172,234 in rural areas. This gap highlights how significantly purchasing power varies across regions, making it a critical variable in any restaurant revenue projection.Competitor Analysis
Competitor analysis is a method restaurant businesses use to comprehensively map the competitive landscape of a given location. This includes identifying which competitors are operating in the area, where they are situated, and how far their catchment zones extend. In this analysis, businesses need to distinguish between two types of competitors. Direct competitors are restaurants with similar concepts, menus, and price points. Indirect competitors are food and beverage businesses that target the same dining needs but through a different approach, such as food stalls, food courts, or delivery-only services. Both types have a real impact on revenue potential at the target location. Beyond simply identifying who the competition is, this analysis helps restaurant businesses uncover deeper strategic insights: whether untapped market gaps still exist in the area, what price ranges competitors are offering for similar menu items, and how much market share they have already captured. These findings serve as a key reference point for shaping pricing strategies, product differentiation, and overall business positioning. By integrating competitor analysis into Location Intelligence, restaurant businesses can build more realistic revenue projections. This is because a location’s revenue potential is shaped not only by the size of its population, but also by how competitive the market already is.Location Intelligence Tools and Platforms Restaurants Can Use
One location intelligence platform worth considering is LOKASI Intelligence. LOKASI is a geospatial analysis platform that combines location intelligence capabilities with comprehensive, real-world location data. The data available on the LOKASI platform includes:- Population demographics
- Foot traffic
- Points of interest
- Disaster risk data
- Socioeconomic status
- Household spending
- Land prices, and more.
- Foot traffic analysis
- Catchment zone analysis
- Demographic
- Purchasing power analysis
- Competitor analysis.
Applying Location Intelligence in the F&B Industry
Location Intelligence helps explain why location has such a direct impact on restaurant revenue. As discussed, restaurant revenue is shaped by several interrelated location factors:- The volume of foot traffic in the area
- The size of the reachable catchment zone
- Whether the demographics and purchasing power of the surrounding community match the target market
- The level of competition at the target location.
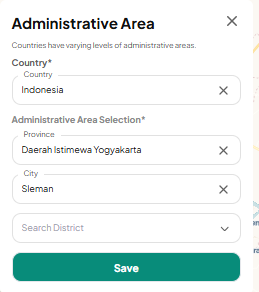 The first step is to enter the location you want to analyze into the LOKASI platform. For this guide, we will use Sleman, Special Region of Yogyakarta, as our example.
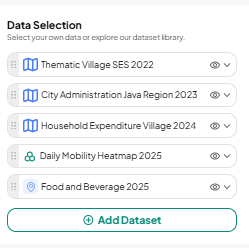 Next, enter the data needed for the analysis. For restaurant revenue projections, there are four main data types to integrate:
- City Administration to analyze the demographic profile of residents in the area
- Household Expenditure and Socioeconomic Status (SES) to measure the purchasing power of the surrounding community
- Mobility Data to understand foot traffic patterns and volumes at the target location
- Food & Beverage Data to map the distribution and density of competitors in the area
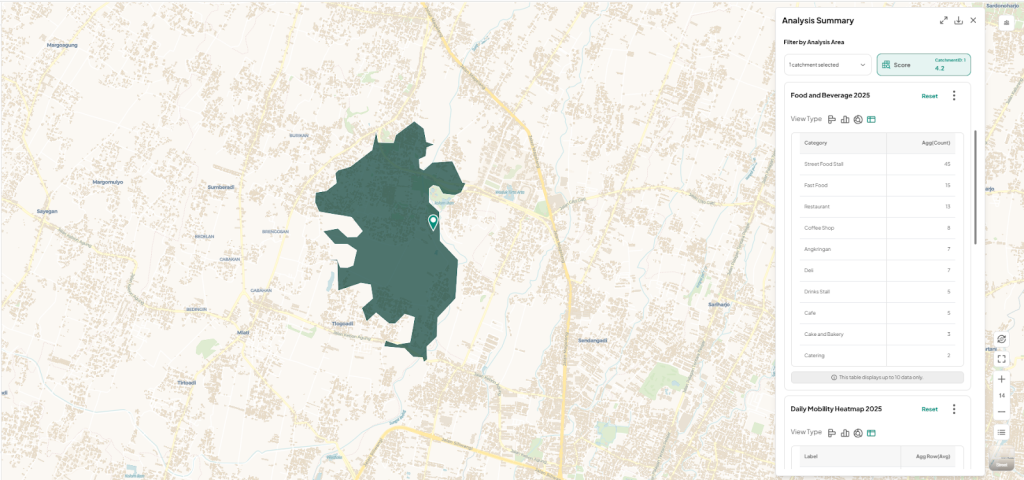
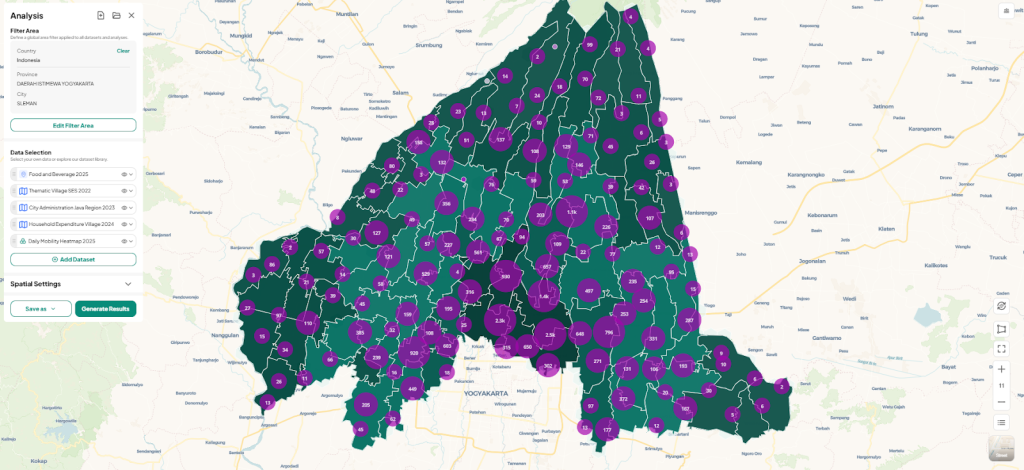 Once the data is successfully integrated, LOKASI will display a visual map of competitor distribution across the Sleman area. From this map, you can see:
- Where restaurants and other culinary businesses are located
- How densely they are concentrated in certain zones
- Which areas remain relatively underserved and present an opportunity for entry
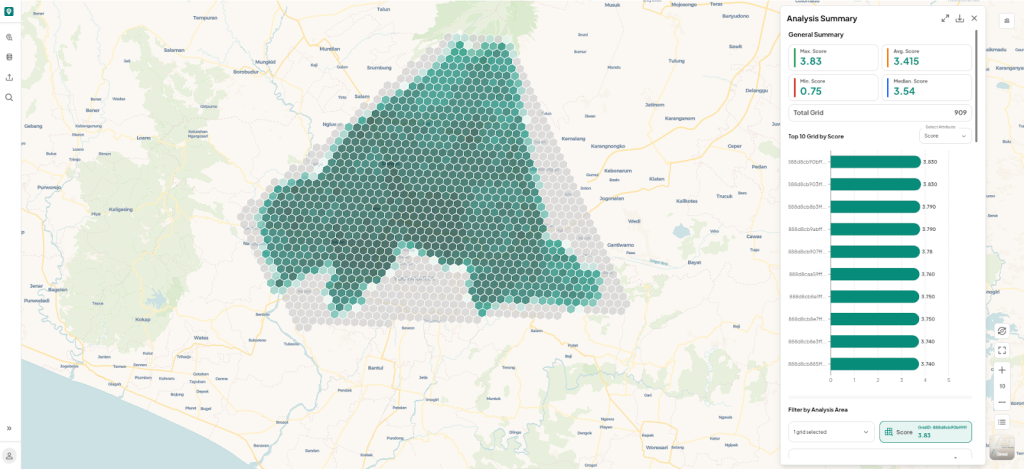 Grid Analysis will display the top 10 most promising locations based on your predefined parameters. The darker the color, the higher the potential.
To explore further, select one of the 10 locations and use the Site Profiling feature.
Grid Analysis will display the top 10 most promising locations based on your predefined parameters. The darker the color, the higher the potential.
To explore further, select one of the 10 locations and use the Site Profiling feature.
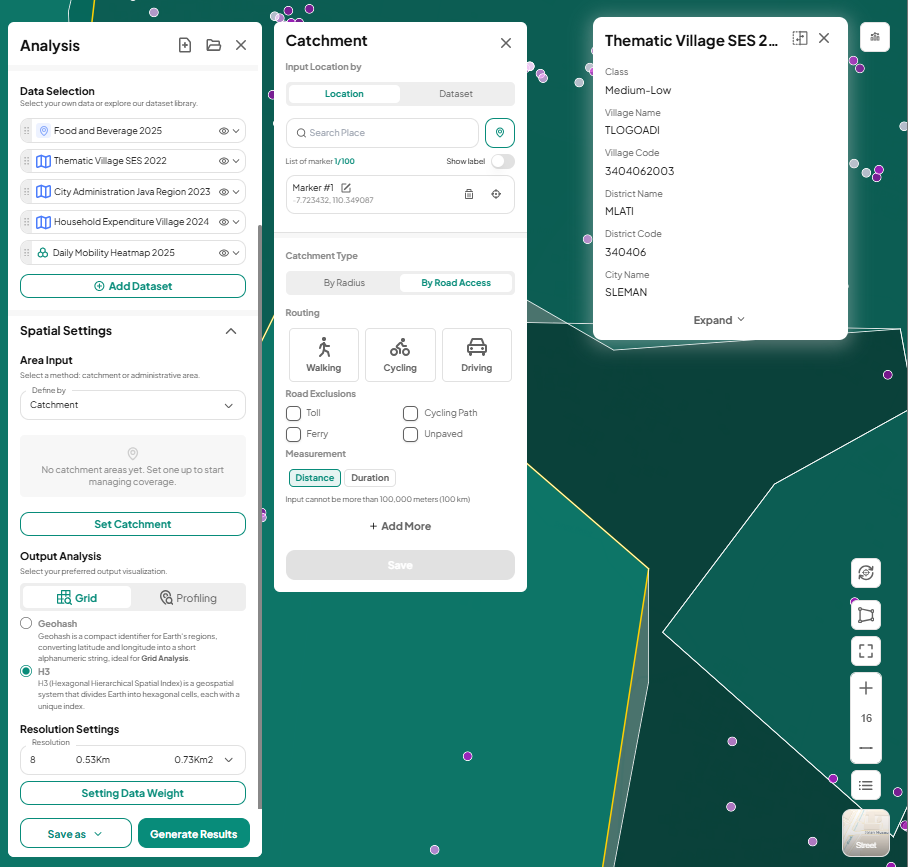 Here, you can define the catchment area by selecting a coverage mode that suits your needs: driving, walking, or cycling.
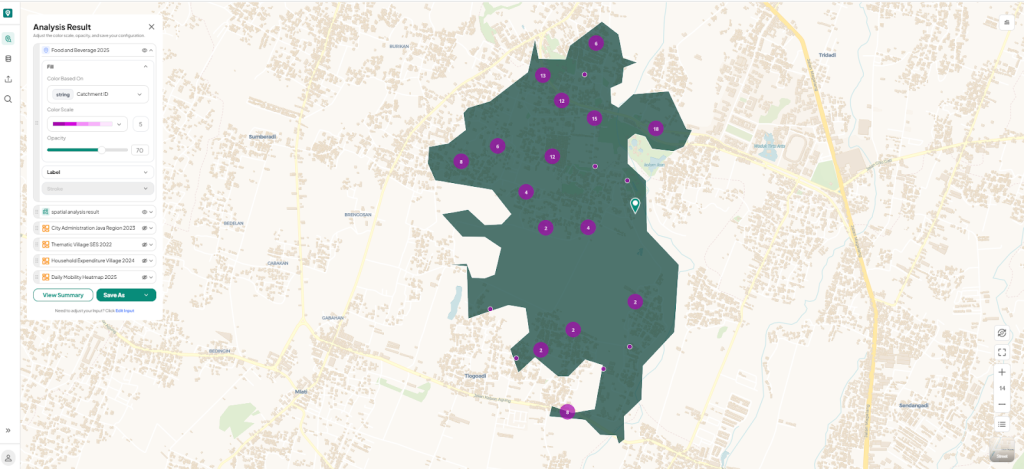 After selecting driving mode, a 2 km catchment area map will appear, showing the distribution of competitors around the location. A full breakdown of the analysis can be found in the panel on the right.