
Contents
The Density Paradox: More Stores, Same Gaps
When a retail chain expands quickly, growth tends to follow a predictable pattern. New stores cluster around already proven high traffic corridors, main roads, intersections near campuses, or areas close to existing successful outlets. It is a reasonable strategy for individual site selection, since each new location gets to piggyback on foot traffic patterns that are already validated. The problem shows up at the network level. Academic research on minimarket distribution in Klaten Regency, Central Java, found that store locations tend toward clustering rather than even spatial spread, and that a 300 meter service radius per store was not sufficient to reach the entire study area. In other words, chains were adding stores in places that already had stores nearby, while other populated areas stayed outside anyone’s service radius entirely. Surakarta illustrates this well. The city has one of the highest population densities in Central Java, more than 11,000 people per square kilometer across just 44 square kilometers of land area, with about two thirds of residents in the productive 15 to 59 age bracket. That is about as strong a demand signal as a retailer could ask for. Yet high density alone does not guarantee that every pocket of that population sits within a convenient distance of a store. Distribution still has to catch up with demand, and in many cases it doesn’t move at the same pace.What “Coverage” Actually Means in Spatial Terms
To talk about coverage precisely, it helps to define two things clearly.- Service area (or catchment area): the zone around a store where customers can reasonably be expected to shop, usually expressed as a fixed radius, for example 300 to 500 meters for a minimarket, or a travel time threshold.
- Blank spot: an area with population density above a meaningful threshold, often the city or district median, that falls outside every existing store’s service area.
- Population density: where people actually live, ideally down to a granular administrative level like village or kelurahan, not just district level averages that can hide local pockets of density.
- Existing store locations: every minimarket, supermarket, and relevant competitor already operating in the area.
How to Identify Coverage Gaps: A Practical Framework
You do not need a GIS degree to run this kind of analysis today. The workflow breaks down into five steps that translate directly into what a location intelligence platform can do.- Step 1, map population density: start with demographic data at the most granular level available. Village or kelurahan level data captures local variation that district or city averages smooth over completely.
- Step 2, map existing stores: plot every minimarket and relevant competitor already operating in the target area, including traditional markets if they compete for the same basket of daily goods.
- Step 3, draw service radius buffers: set a realistic catchment radius around each store location, informed by walking distance norms or prior research on effective service ranges.
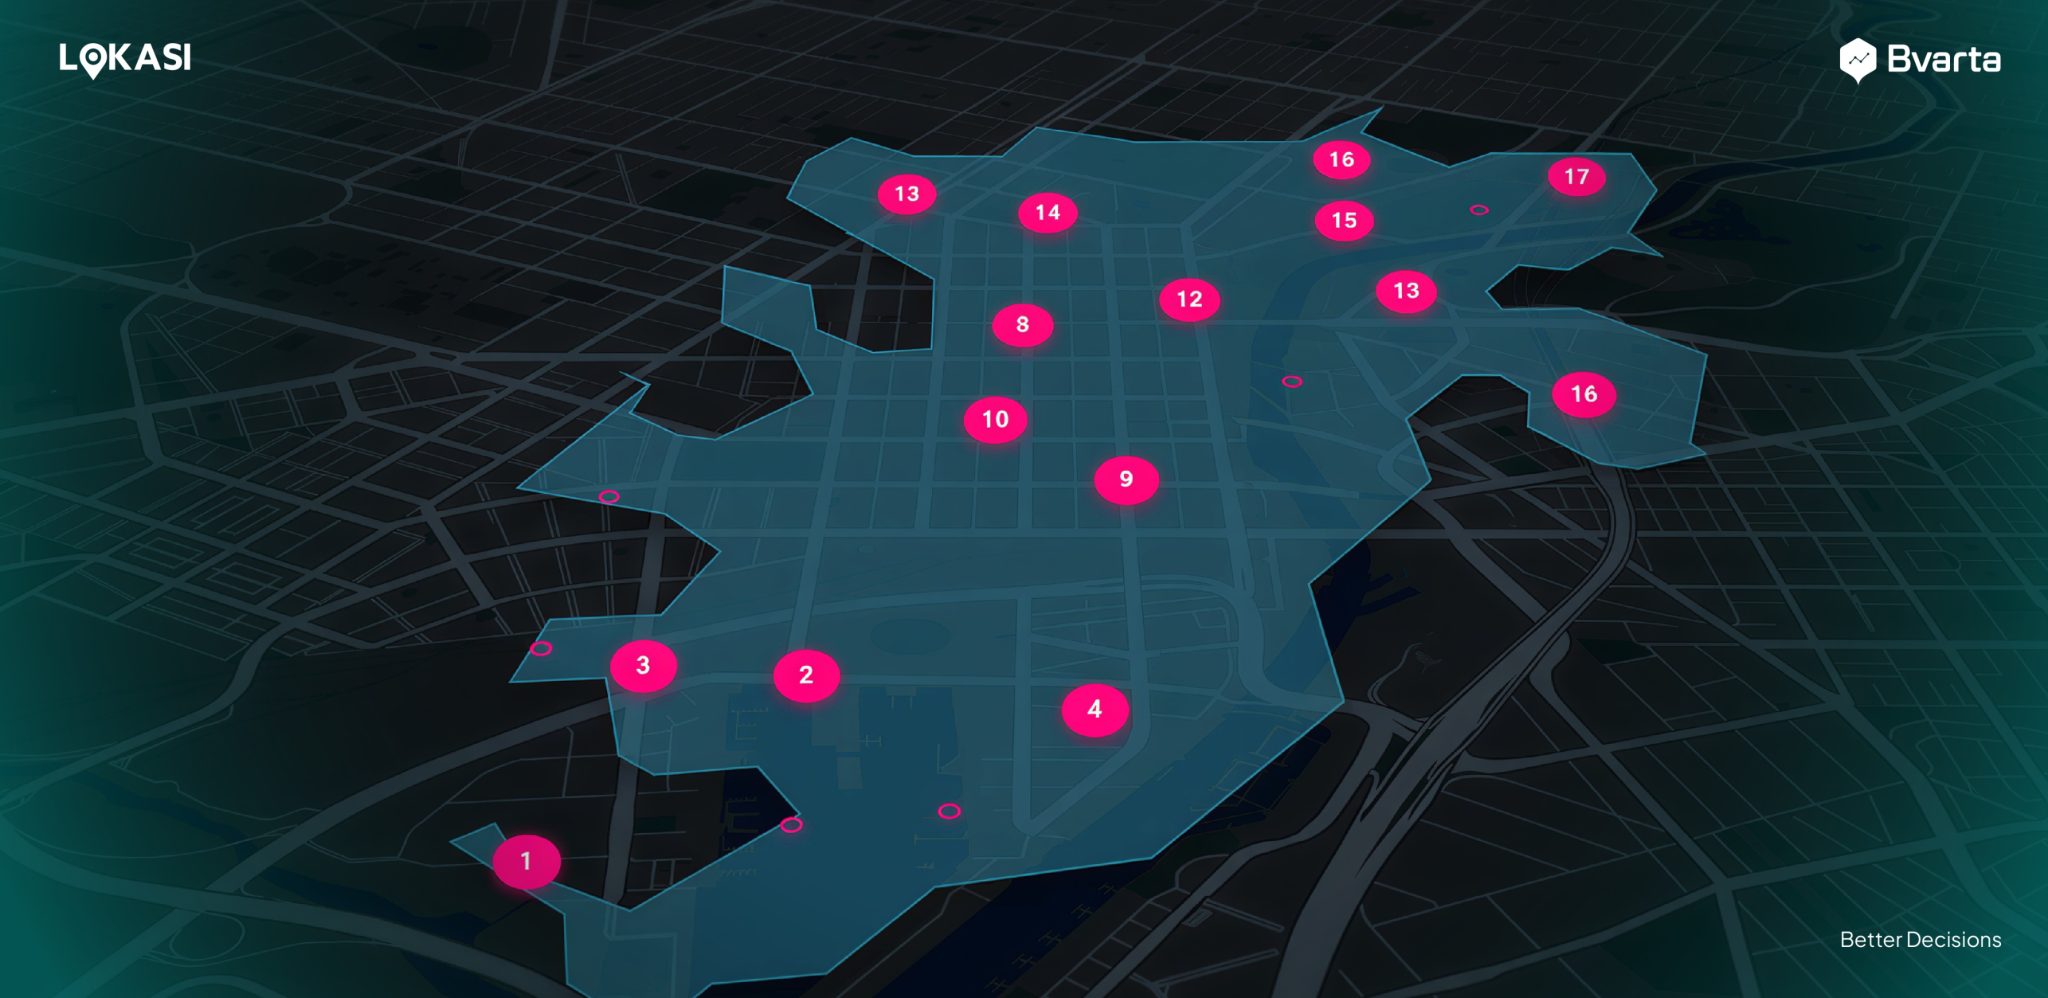
- Step 4, overlay and identify gaps: layer the population density surface against the combined service buffers. Anywhere with above median population density that falls outside every buffer is a candidate blank spot.
- Step 5, score and prioritize: not every blank spot deserves equal urgency. Rank candidates using a combination of factors: population density, population growth rate, blank spot area, and distance to the nearest competing outlet such as a traditional market.
Why This Matters for Expansion Strategy
Coverage analysis solves two opposite problems at once. The first is cannibalization. Opening a new store too close to an existing one splits the same demand pool between two locations instead of capturing new customers, which quietly erodes margins across the network even as the store count headline keeps climbing. The second is blind spots. Skipping over a genuinely underserved, high density area means leaving demand on the table for a competitor to capture first. In a market as densely populated and fast growing as Indonesian FMCG retail, that is not a hypothetical risk. It is a matter of time before someone else runs the same analysis. Balancing these two failure modes means treating expansion targets as a coverage metric, not just a count metric. A network that opens fifty new stores but only marginally improves service area coverage has grown its footprint without necessarily growing its addressable market.Human Judgment Still Matters
Spatial analysis narrows down where to look. It does not make the final call. A blank spot flagged by density and buffer overlays still needs to be checked against practical constraints: is there available commercial space, what is the rental cost, are there zoning restrictions, and how close is the nearest direct competitor beyond what the data captures. Location intelligence tools are built to surface where the opportunity likely sits, not to replace the judgment of a site selection team that understands the ground reality of a specific street or block.Conclusion
Store count growth headlines are easy to celebrate, but they answer the wrong question for a retail network trying to grow sustainably. The question that matters is coverage: how much of your addressable market actually sits within reach of a store. Surakarta’s case, a city with some of the highest population density in Central Java, shows that even fast growing retail networks can leave real gaps behind if expansion isn’t guided by where people actually live relative to where stores already are. Running this kind of density and coverage analysis used to require dedicated GIS software and a trained analyst. Platforms like LOKASI Intelligence bring population density, store locations, and catchment analysis into one workflow, making it practical for retail and FMCG teams to check their coverage before committing to a new lease. Curious where your own network’s blank spots might be? Reach out to the Bvarta team at WhatsApp 0877 7907 7750 to see how LOKASI Intelligence can map your coverage gaps.Research Note
This article was inspired by academic coursework from Adinda Fauzia Azizah, a student in the Geographic Information Systems program at Universitas Gadjah Mada’s Vocational School (Sekolah Vokasi UGM). Her 2026 paper, “Identifikasi Blank Spot Gerai FMCG Kota Surakarta Menggunakan Site Profiling dan Buffer Analysis,” applied Kernel Density Estimation and buffer analysis to study minimarket coverage gaps in Surakarta, and its framework shaped the analytical approach discussed here. Great work, and a good reminder that some of the sharpest applied GIS thinking is coming out of Indonesian classrooms right now.FAQ
What is a retail blank spot?
A blank spot is an area with meaningful population density that falls outside the practical service radius of every existing store in a category. It represents underserved demand rather than an absence of demand.How is store service coverage measured?
Coverage is typically measured by drawing a fixed radius, known as a buffer or catchment area, around each store location and checking what portion of the surrounding population falls inside versus outside that radius.Is a 300 to 500 meter radius always the right measure for a minimarket?
Not necessarily. The right radius depends on local walking culture, road connectivity, and store format. Research in some Indonesian regencies found even a 300 meter radius insufficient to reach the full study area, which suggests radius assumptions should be tested locally rather than applied as a fixed rule.Can this kind of analysis be applied to cities outside Indonesia?
Yes. The underlying method, population density mapping combined with service area buffers, is a general spatial analysis approach used in retail location planning globally, not something specific to any one country’s market.Do I need GIS software to run a coverage analysis?
Traditionally yes, tools like QGIS were the standard. Location intelligence platforms now package the same demographic data, POI data, and buffer analysis tools into a single interface, which lowers the barrier for retail and FMCG teams without a dedicated GIS analyst on staff.References
Adinda (2026). Identifikasi Blank Spot Gerai FMCG Kota Surakarta Menggunakan Site Profiling dan Buffer Analysis. Benoit, D., & Clarke, G. P. (1997). Assessing GIS for retail location planning. Journal of Retailing and Consumer Services, 4(4), 239–258. https://doi.org/10.1016/S0969-6989(96)00047-1 BPS Kota Surakarta. (2024). Kota Surakarta dalam Angka 2024. Badan Pusat Statistik Kota Surakarta. Hidayah, B., & Amin, C. (2021). Analisis pola spasial dan faktor pemilihan lokasi minimarket di Kabupaten Klaten. Media Komunikasi Geografi, 22(2), 171–182. https://doi.org/10.23887/mkg.v22i2.36806 Luo, X., Che Rose, R. A., & Awang, A. (2025). The evolution of retail outlet distribution: A systematic review of spatial patterns, drivers, and implications for urban development and economic growth. Frontiers in Sustainable Cities, 7, 1628137. https://doi.org/10.3389/frsc.2025.1628137 Luo, X., Che Rose, R. A., & Awang, A. (2025). GIS-based analysis of retail spatial distribution and driving mechanisms in a resource-based transition city: Evidence from POI data in Taiyuan, China. ISPRS International Journal of Geo-Information, 14(12), 483. https://doi.org/10.3390/ijgi14120483