
Contents
- 1 Why Yogyakarta’s Education Corridor Is Such a Promising Market
- 2 The Problem With Expanding Without Spatial Data
- 3 What Site Suitability Analysis and Whitespace Analysis Actually Are
- 4 The Methodology: Hexagonal Grid and Catchment Radius
- 5 The Variables and Weights Behind the Scoring
- 6 Where the Data Comes From, and How Location Intelligence Makes It Usable
- 7 What the Analysis Produces
- 8 Who Benefits From This Kind of Approach
- 9 Conclusion
- 10 A Shoutout to the Author of This Study
- 11 See Your Own Whitespace Map With LOKASI Intelligence
- 12 FAQ
- 13 References
Why Yogyakarta’s Education Corridor Is Such a Promising Market
Sleman and the City of Yogyakarta are home to more than 100 universities and hundreds of secondary schools. The student population in this region is large and stays fairly consistent throughout the academic year, making it a highly relevant market for F&B brands built around affordable pricing. Store clusters for this kind of product tend to follow a predictable pattern: they gather around campuses, student boarding areas, and commercial corridors with high foot traffic (Widaningrum et al., 2020). This is exactly why proximity to education centers becomes the primary variable in determining site feasibility. Still, this large opportunity also carries real risk when expansion decisions skip a systematic spatial analysis.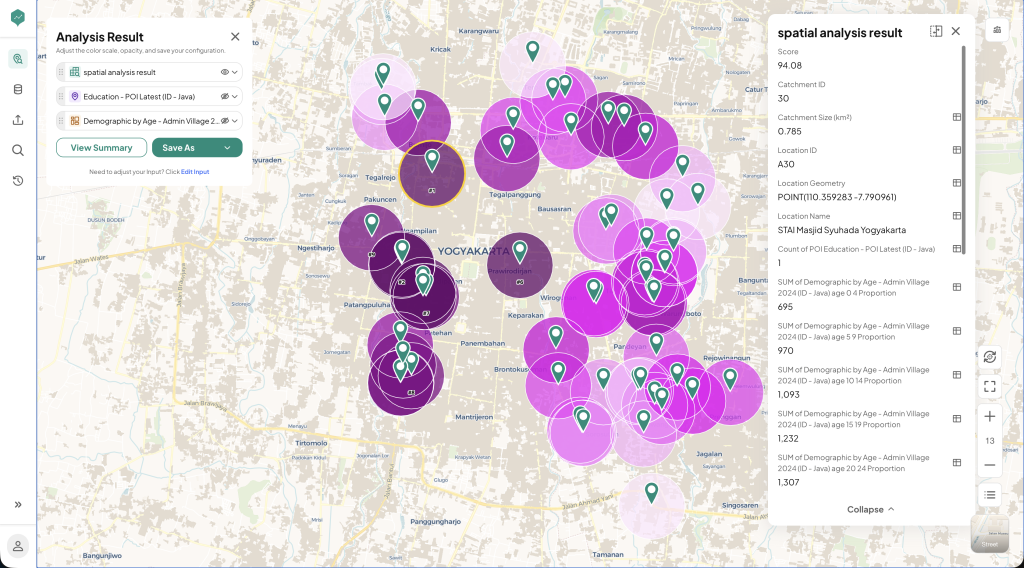 Figure 1: Catchment analysis around an education point of interest (STAI Masjid Syuhada, Yogyakarta) in LOKASI Intelligence, showing the age 15-24 population feeding the site suitability score.
The Problem With Expanding Without Spatial Data
Intuition-driven expansion has a few weaknesses that usually only surface after a store opens and underperforms. The most common risks include:- Cannibalization between outlets when locations sit too close to each other.
- Choosing sites that look promising on the surface but are actually weak in demographics or purchasing power.
- Missing whitespace near campuses, meaning high-potential areas that no brand has entered yet.
What Site Suitability Analysis and Whitespace Analysis Actually Are
These two methods are combined in layers to produce an analysis that is both comprehensive and immediately actionable. Site Suitability Analysis evaluates the feasibility of each area based on a weighted score built from several variables, such as proximity to campuses or schools, density of the young population, traffic, and socioeconomic status. This produces an objective, scalable score across the entire study area at once. Whitespace Analysis identifies the gap between high-potential areas and the coverage already claimed by existing outlets and competitors. This is the method that surfaces hidden expansion opportunities nobody has entered yet. Here is how this GIS-based approach compares to conventional site selection. Table 1. Comparison of conventional site selection and a GIS-based approach.| Factor | Conventional Limitation | GIS-Based Solution |
| Location selection method | Location selection based on intuition and manual surveys | Standardized multivariable scoring built on spatial data |
| Whitespace detection | No systematic way to detect whitespace | POI overlay of competitors combined with demand vs. supply gap analysis |
| Site comparison at scale | Hard to compare hundreds of candidate sites at once | Automated grid analysis across the entire area in a single process |
| Cannibalization risk | Cannibalization risk between outlets goes undetected | Catchment analysis and buffer radius around existing stores |
| Business feasibility | Business feasibility is not measured without rental data | Property price data integrated directly into the scoring model |
The Methodology: Hexagonal Grid and Catchment Radius
One of the more interesting parts of this study is its use of an H3-8 hexagonal grid, roughly 0.73 square kilometers per cell, as the analysis unit for the entire study area. A spatial grid approach like this overcomes the bias that comes from using administrative boundaries, which rarely reflect real consumer mobility patterns, making the resulting analysis far more accurate than simply grouping data by district or sub-district (Widyastuti et al., 2021). The catchment radius also differs depending on the type of store. Existing outlets are measured with a 500-meter radius, while competitors are measured at 300 meters. That 300-meter figure is not arbitrary. It is based on the average three-to-four-minute walking distance that represents how far a student consumer is realistically willing to travel for an affordable drink near campus (Widyastuti et al., 2021). The analysis runs through three sequential stages: collecting and integrating every spatial data layer, running Site Suitability Analysis to produce a suitability score map, and finally running Whitespace Analysis, which overlays that score against the catchment of existing outlets and competitors to produce a whitespace zone map and a ranked priority list.The Variables and Weights Behind the Scoring
Site feasibility is calculated from six weighted variables, built around the consumption patterns of the 15 to 24 age group. National expenditure data shows that 68 percent of spending on this kind of drink happens within a 500-meter radius of the nearest educational institution, which is the strongest justification for weighting campus proximity so heavily. Table 2. Site suitability scoring variables and weights.| Variable | Weight | Rationale |
| Proximity to campuses and schools | 30% | Students are the core customer base |
| Population density aged 15-24 | 20% | Direct representation of target market size |
| Traffic and road accessibility | 20% | Directly affects walk-in traffic |
| Property rental price (inverse) | 15% | Ensures financial viability |
| Area socioeconomic status | 10% | Ensures minimum purchasing power is met |
| Density of supporting POIs (boarding houses, small shops, minimarkets) | 5% | Indicator of commercial activity and student housing density |
Where the Data Comes From, and How Location Intelligence Makes It Usable
The scoring model draws on a wide range of spatial layers: education POIs, demographic and socioeconomic data, competitor and existing outlet locations, road networks, administrative boundaries, and property rental prices. Pulling individual layers like these from open sources such as OpenStreetMap, national statistics agencies, and geospatial government bodies is possible on a one-off basis, but stitching them into a single clean, analysis-ready dataset, and keeping that dataset current, is where most teams lose the most time. This is exactly the gap a location intelligence platform such as LOKASI Intelligence is built to close. Instead of manually collecting and cleaning each layer, it brings POI, demographic, socioeconomic, and mobility data together in one place, so a team can lay a demographic profile directly on top of education POI density, or check competitor coverage against real population movement, without stitching together spreadsheets from a dozen separate sources. For a study like this one, that means the demographic and POI education layer behind the scoring model can be pulled, validated, and refreshed on an ongoing basis rather than rebuilt from scratch every time the model needs updating. Integrating rental price data is also an important differentiator here, since most location analyses stop at demand potential without checking whether a site is actually financially viable to rent and operate.What the Analysis Produces
The final output of this analysis is built to be used directly by an expansion team, not just filed away as an academic report. The three main deliverables are:- Ranked List, a prioritized list of grid cells and neighborhoods ranked from highest to lowest suitability score, complete with GPS coordinates and the spatial reasoning behind each score.
- Map Series, three thematic maps covering the distribution of education centers, whitespace zones not yet covered by competitors, and a final map of recommended expansion points.
- Recommendation Report, a narrative summary for each priority location explaining its feasibility based on demographic profile and surrounding competitive conditions.
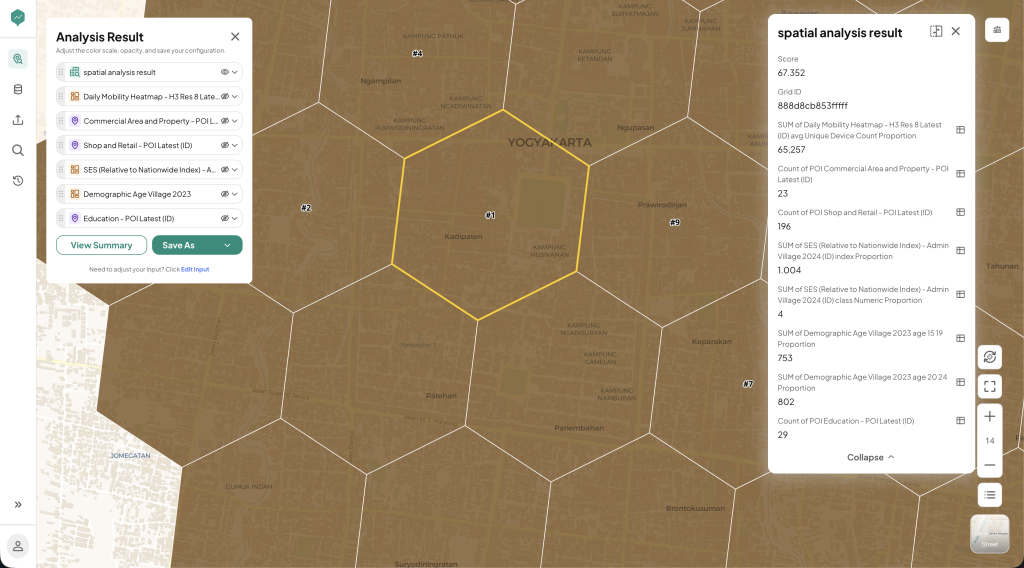 Figure 2: Site Suitability Score map for Sleman and the City of Yogyakarta generated in LOKASI Intelligence, combining education density, age 15-24 demographics, daily mobility, commercial and retail density, and socioeconomic status.
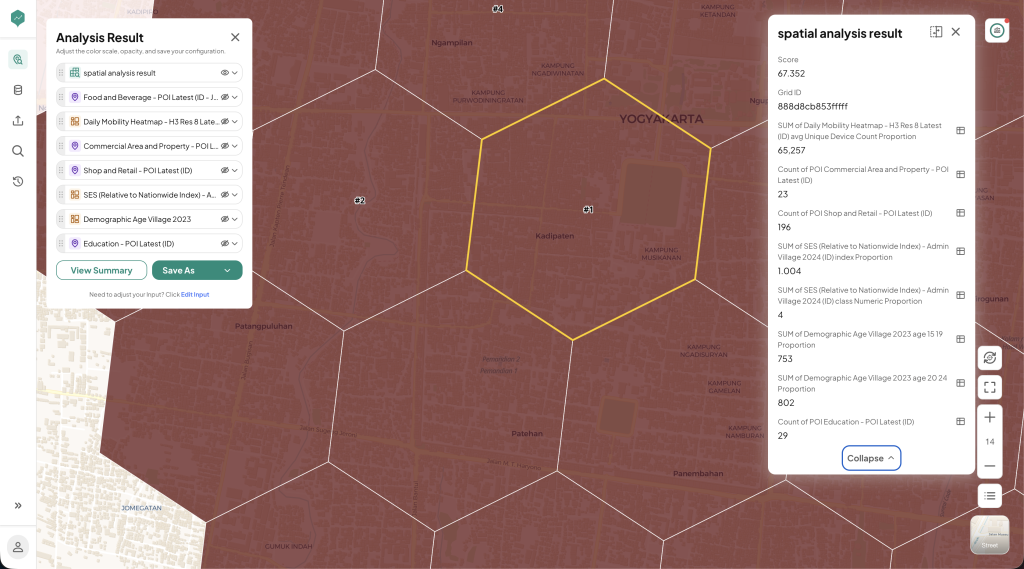 Figure 3: Analysis summary showing the score distribution and the top 10 highest-scoring grid cells across Sleman and the City of Yogyakarta.