Contents
- 1 Sales Numbers Don’t Tell the Full Story
- 2 The Concept of Location Efficiency
- 3 How Location Intelligence Diagnoses the Problem
- 4 What You Can Actually Do About It
- 5 The Takeaway
- 6 Frequently Asked Questions
- 6.1 How do I know if my store is underperforming because of location or something else?
- 6.2 Are there risks to relocating a store that’s already performing reasonably well?
- 6.3 How often should existing store locations be evaluated?
- 6.4 Does the concept of location efficiency apply to all types of retail?
- 7 References
Sales Numbers Don’t Tell the Full Story
When evaluating store performance, most retailers look at revenue, conversion rate, and average transaction value. These are important, but they’re lagging indicators — they tell you what happened, not why, and they definitely don’t tell you what you’re leaving on the table. Location data adds the context that sales data alone can’t provide:- How many potential customers pass within 500m of your store every day but never walk in?
- Is your store positioned between your customers’ home and their workplace — or out of the way?
- Are competitors nearby pulling traffic that should be coming to you?
- Is the surrounding demographic shifting in ways that might affect your store in 12–24 months?
The Concept of Location Efficiency
Think of it this way: location efficiency is the ratio of actual performance to potential performance. The idea draws on Data Envelopment Analysis (DEA), a benchmarking method that retail researchers have used to evaluate store performance against top-performing peers rather than against an arbitrary target (Vyt & Cliquet, 2017; Almohri, Chinnam, & Colosimo, 2018). A store scoring 90% on location efficiency is doing almost everything right. A store at 40% means there’s a significant gap between what it’s achieving and what it could achieve, and the reason is often location-related, not operational. Common location inefficiencies include:- Poor visibility: Even on a busy street, a storefront that blends into its surroundings, lacks clear signage, or sits behind obstructions like trees, parked vehicles, or neighboring buildings will struggle to convert passersby into customers. People cannot walk into a store they never register seeing in the first place.
- Wrong side of the street: Pedestrian and vehicle flow is rarely split evenly between both sides of a road, especially during morning and evening commute hours. A store on the side people are not walking toward has to overcome the simple friction of getting someone to cross, and in high-traffic corridors, most people will not bother.
- Misaligned catchment: A location can have excellent foot traffic and still underperform if the people living and working nearby do not match the store’s target customer. A premium product sitting in a budget-conscious neighborhood, or a value-focused format placed in an upscale enclave, creates friction that no amount of marketing fully resolves
- Insufficient anchor: Stores rarely thrive in isolation. Locations near supermarkets, transit stations, schools, or office clusters benefit from a steady stream of organic foot traffic generated by these anchor points. Without one nearby, a store has to work harder, and spend more on marketing, just to attract the same number of visits.
How Location Intelligence Diagnoses the Problem
This is where tools like LOKASI Intelligence become genuinely useful. Rather than relying on intuition or post-hoc revenue analysis, location intelligence lets you map the gap between demand and capture.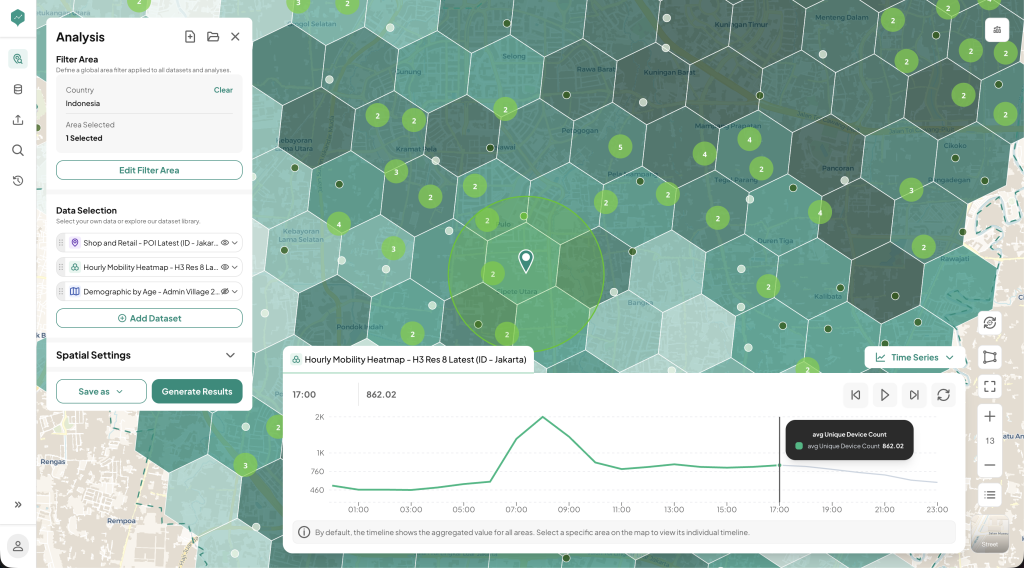 Figure 1: Demand & Capture Gap Map with LOKASI Intelligence
This is where the gap stops being abstract. With location intelligence, you can:
Figure 1: Demand & Capture Gap Map with LOKASI Intelligence
This is where the gap stops being abstract. With location intelligence, you can:
- Visualize where your current customers are coming from. For example, a customer origin map might show that 70% of footfall originates from a residential cluster 800 meters northeast of the store, while an equally dense cluster 1.2 kilometers south contributes less than 5%, revealing an untapped pocket of demand nearby.
- Measure real foot traffic patterns around your stores. Comparing two outlets might show Store A receiving roughly 4,200 daily pedestrian passes with only a 3% walk-in rate, against Store B’s 2,100 daily passes but a 9% walk-in rate, immediately surfacing a visibility or conversion gap between the two.
- Compare your locations against competitor positioning. Finding that three competing minimarkets sit within a 600-meter radius of one store, while a sister location enjoys a 1.5-kilometer buffer, helps explain part of the performance difference between them.
- Model what a relocation or new nearby store would do to your network. A simulation might show that moving a store 250 meters closer to a transit hub could lift projected monthly foot traffic by 18%, while opening a new location in the same trade area adds only 6% net new revenue once cannibalization is factored in.
What You Can Actually Do About It
Once you’ve identified a location efficiency gap, you have a few options:- Relocate: If the lease allows it and the gap is significant enough, moving even 200–300m can make a measurable difference.
- Adjust the format: A location with lower footfall might work better as a smaller, lower-overhead format rather than a full-size store.
- Boost local activation: Targeted hyperlocal marketing to the catchment area can compensate for some location disadvantages.
- Factor it into future expansion: Use the learnings to set stricter location criteria for your next store opening.