Contents
Catchment Area
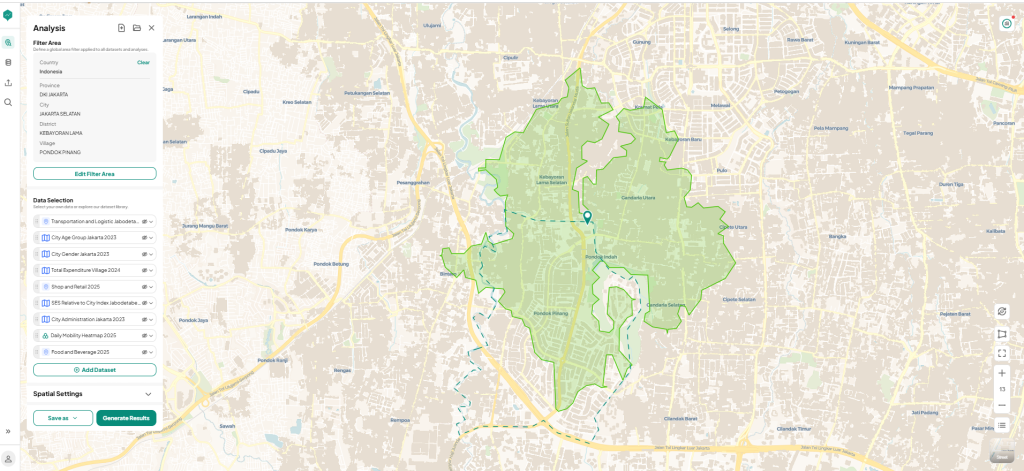 Figure 1: Catchment area map of PIM 5 based on a 3 km driving-mode isochrone from LOKASI Intelligence.
To truly grasp the condition around PIM 5, we conducted an analysis using a 3 km driving-mode catchment area, meaning the boundary is not drawn as a perfect circle, but rather shaped organically by the actual road network accessible by car, motorcycle, or bicycle. This gives us a far more realistic picture of who can realistically reach this location. Within this catchment, the analysis captures some of South Jakarta’s most affluent and densely populated residential corridors, including Pondok Indah, Kebayoran Baru, and Cilandak forming a market that is not only large in scale but exceptionally high in purchasing power.
Figure 1: Catchment area map of PIM 5 based on a 3 km driving-mode isochrone from LOKASI Intelligence.
To truly grasp the condition around PIM 5, we conducted an analysis using a 3 km driving-mode catchment area, meaning the boundary is not drawn as a perfect circle, but rather shaped organically by the actual road network accessible by car, motorcycle, or bicycle. This gives us a far more realistic picture of who can realistically reach this location. Within this catchment, the analysis captures some of South Jakarta’s most affluent and densely populated residential corridors, including Pondok Indah, Kebayoran Baru, and Cilandak forming a market that is not only large in scale but exceptionally high in purchasing power.
Demography
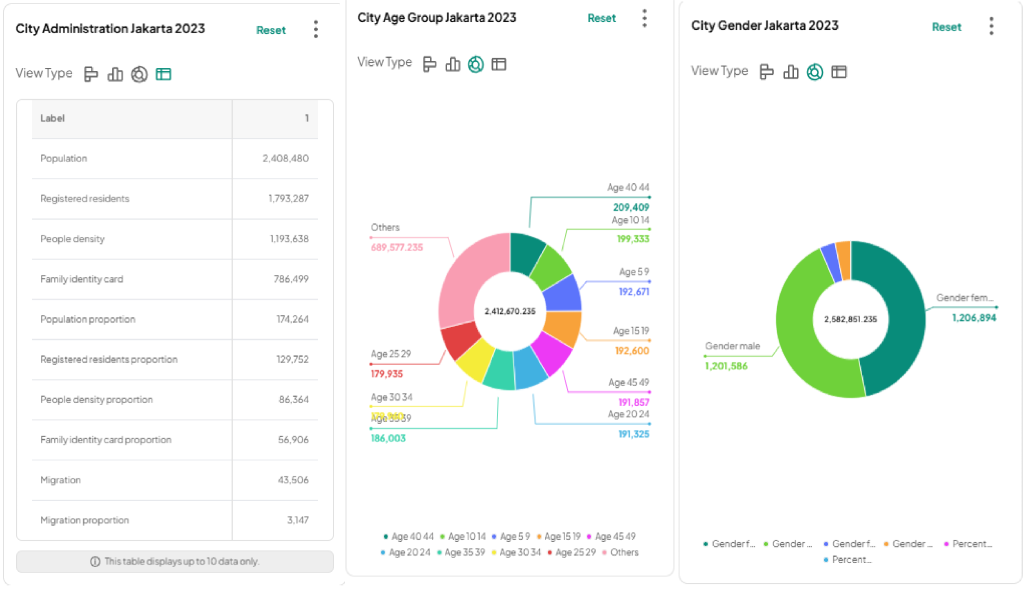 Figure 2: City administration, age, and gender records derived from Statistics Indonesia (BPS) for 2023.
First, let’s take a deeper look at the people who live around the area. From the administrative data on the left, we can see the scale of the market. The total population exceeds 2 million.
This number represents everyone living in the area, regardless of their official status. Meanwhile, the number of registered residents, those whose identity cards list the area as their official domicile, is significantly lower, almost half of the total population.
This gap highlights a large presence of non-registered residents, such as commuters, renters, and temporary dwellers, which is especially relevant for a commercial hub like Pondok Indah Mall 5 because it indicates a broader and more dynamic consumer base beyond just official residents.
Moving to the middle section, the age group distribution gives a clearer picture of the market composition. There are around 209 thousand people aged 40–44, nearly 180 thousand in the 25–29 range, and about 192 thousand aged 15–19.
The rest of the population falls outside these highlighted groups, forming a diverse mix across other age segments. This indicates a balanced demographic, with both productive-age adults and younger consumers contributing to the market.
For Pondok Indah Mall 5, this means potential demand across multiple categories, from lifestyle and F&B to family-oriented and youth-driven retail.
Lastly, from the gender distribution, we can see the proportion between male and female residents is relatively balanced. This further strengthens the area’s appeal as a retail destination, as it supports a wide range of tenant mixes and consumer preferences.
Figure 2: City administration, age, and gender records derived from Statistics Indonesia (BPS) for 2023.
First, let’s take a deeper look at the people who live around the area. From the administrative data on the left, we can see the scale of the market. The total population exceeds 2 million.
This number represents everyone living in the area, regardless of their official status. Meanwhile, the number of registered residents, those whose identity cards list the area as their official domicile, is significantly lower, almost half of the total population.
This gap highlights a large presence of non-registered residents, such as commuters, renters, and temporary dwellers, which is especially relevant for a commercial hub like Pondok Indah Mall 5 because it indicates a broader and more dynamic consumer base beyond just official residents.
Moving to the middle section, the age group distribution gives a clearer picture of the market composition. There are around 209 thousand people aged 40–44, nearly 180 thousand in the 25–29 range, and about 192 thousand aged 15–19.
The rest of the population falls outside these highlighted groups, forming a diverse mix across other age segments. This indicates a balanced demographic, with both productive-age adults and younger consumers contributing to the market.
For Pondok Indah Mall 5, this means potential demand across multiple categories, from lifestyle and F&B to family-oriented and youth-driven retail.
Lastly, from the gender distribution, we can see the proportion between male and female residents is relatively balanced. This further strengthens the area’s appeal as a retail destination, as it supports a wide range of tenant mixes and consumer preferences.
Social Economy
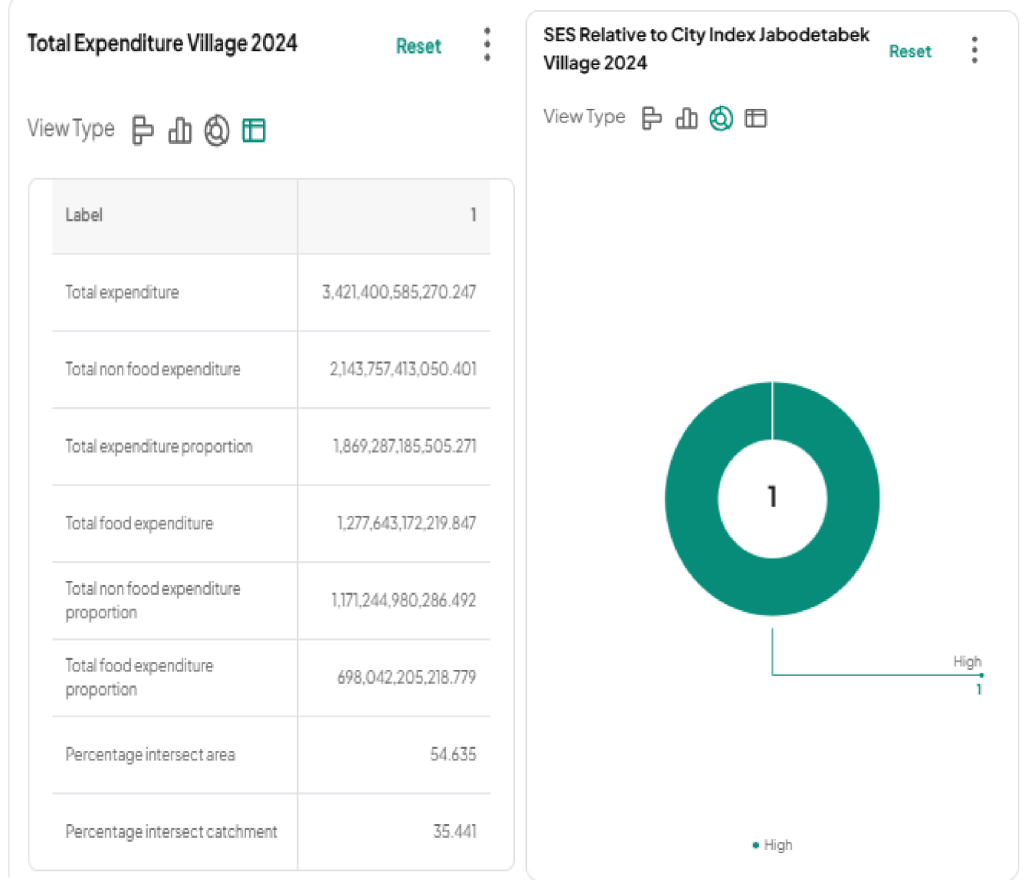 Figure 3: Expenditure data and Socioeconomic Status (SES) classification within the 3 km driving-mode catchment area surrounding PIM 5, South Jakarta. Figures reflect aggregate annual consumer expenditure across food and non-food categories.
Demographics tell us who lives around PIM 5. But it is the expenditure data and Socioeconomic Status (SES) classification that tells us something far more commercially significant: how much they spend, and what they spend it on.
Let’s begin with the Socioeconomic Status breakdown.
The data shows that the majority of residents living within the 3 km catchment around PIM 5 are classified as upper class. This is not a surprise to anyone familiar with the Pondok Indah, but seeing it confirmed in demographic data is powerful, because it transforms what is often assumed into something that can be cited, presented, and built upon.
Pondok Indah has long been regarded as one of Jakarta’s most prestigious residential addresses. It is home to some of the city’s most exclusive housing clusters, high-end landed properties, luxury apartments, and gated communities that have attracted Jakarta’s professional elite, business owners, senior corporate executives, expatriate families, and established upper-middle-class households for decades.
The SES data is simply the formal confirmation of what the neighborhood has always represented.
What makes this particularly compelling in the context of a new mall opening is that upper-class consumers are not just high spenders in absolute terms, they are also quality-driven, experience-oriented, and brand-loyal in ways that benefit a premium retail destination disproportionately.
They do not just spend more. They spend better, gravitating toward established brands, premium dining, curated lifestyle experiences, and retail environments that meet their expectation of quality and exclusivity. PIM 5, positioned as the next evolution of the iconic Pondok Indah Mall brand, is precisely the kind of destination this demographic has been primed to embrace.
Now let’s talk about the expenses.
The combined annual expenditure of the population living within PIM 5’s catchment area exceeds 3 trillion Rupiah.
Of the more than 3 trillion Rupiah in annual expenditure, approximately 2 trillion Rupiah, roughly two-thirds of total spending, is directed toward non-food categories.
This is important data point for PIM 5’s leasing strategy and tenant mix planning.
Non-food expenditure encompasses fashion and apparel, beauty and personal care, electronics and gadgets, home furnishings and decor, lifestyle and wellness services, entertainment, education, and the full spectrum of discretionary retail that defines what a modern premium mall is built to deliver.
Meanwhile, the remaining 1 trillion Rupiah, approximately one-third of total spending, flows into food categories. This number in annual food expenditure would already represent an exceptional market for any F&B business.
Figure 3: Expenditure data and Socioeconomic Status (SES) classification within the 3 km driving-mode catchment area surrounding PIM 5, South Jakarta. Figures reflect aggregate annual consumer expenditure across food and non-food categories.
Demographics tell us who lives around PIM 5. But it is the expenditure data and Socioeconomic Status (SES) classification that tells us something far more commercially significant: how much they spend, and what they spend it on.
Let’s begin with the Socioeconomic Status breakdown.
The data shows that the majority of residents living within the 3 km catchment around PIM 5 are classified as upper class. This is not a surprise to anyone familiar with the Pondok Indah, but seeing it confirmed in demographic data is powerful, because it transforms what is often assumed into something that can be cited, presented, and built upon.
Pondok Indah has long been regarded as one of Jakarta’s most prestigious residential addresses. It is home to some of the city’s most exclusive housing clusters, high-end landed properties, luxury apartments, and gated communities that have attracted Jakarta’s professional elite, business owners, senior corporate executives, expatriate families, and established upper-middle-class households for decades.
The SES data is simply the formal confirmation of what the neighborhood has always represented.
What makes this particularly compelling in the context of a new mall opening is that upper-class consumers are not just high spenders in absolute terms, they are also quality-driven, experience-oriented, and brand-loyal in ways that benefit a premium retail destination disproportionately.
They do not just spend more. They spend better, gravitating toward established brands, premium dining, curated lifestyle experiences, and retail environments that meet their expectation of quality and exclusivity. PIM 5, positioned as the next evolution of the iconic Pondok Indah Mall brand, is precisely the kind of destination this demographic has been primed to embrace.
Now let’s talk about the expenses.
The combined annual expenditure of the population living within PIM 5’s catchment area exceeds 3 trillion Rupiah.
Of the more than 3 trillion Rupiah in annual expenditure, approximately 2 trillion Rupiah, roughly two-thirds of total spending, is directed toward non-food categories.
This is important data point for PIM 5’s leasing strategy and tenant mix planning.
Non-food expenditure encompasses fashion and apparel, beauty and personal care, electronics and gadgets, home furnishings and decor, lifestyle and wellness services, entertainment, education, and the full spectrum of discretionary retail that defines what a modern premium mall is built to deliver.
Meanwhile, the remaining 1 trillion Rupiah, approximately one-third of total spending, flows into food categories. This number in annual food expenditure would already represent an exceptional market for any F&B business.
Surrounding Area
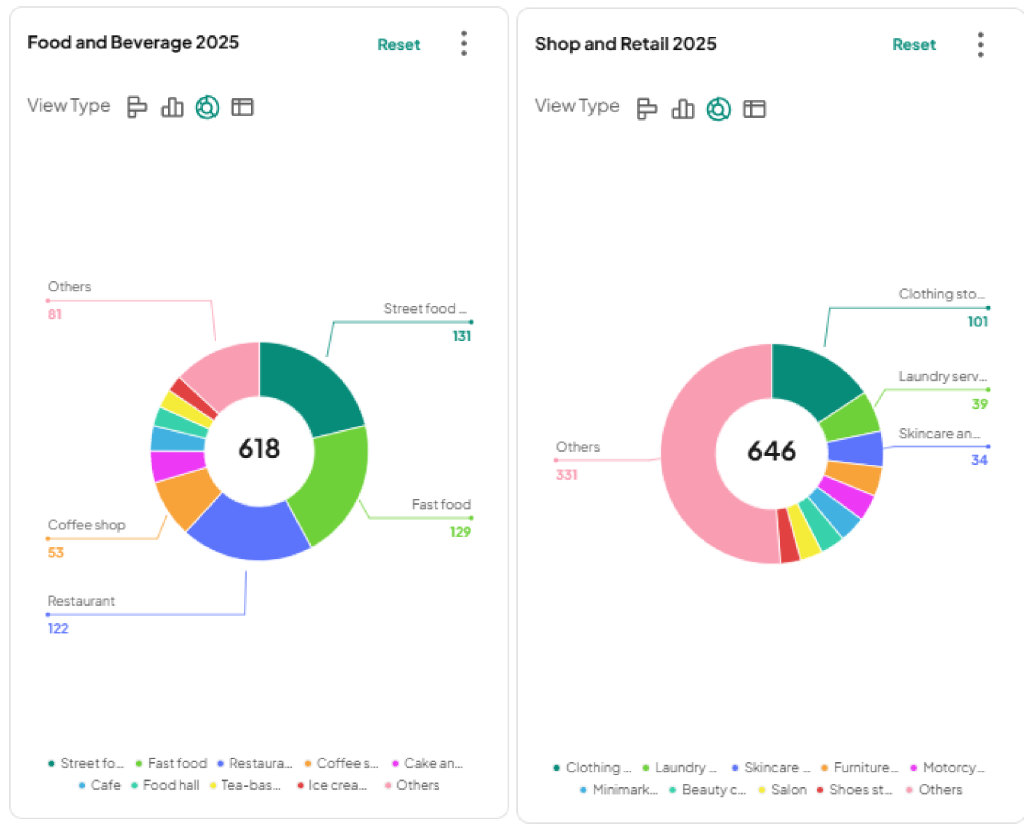 Figure 4: Point-of-interest (POI) mapping of F&B and retail establishments within the 3 km driving-mode catchment area surrounding PIM 5, South Jakarta.
From the visuals above, we can start to map out the commercial landscape surrounding Pondok Indah Mall 5, particularly within a 3 km radius. This gives us a grounded view of existing supply.
In the first image, the food and beverage category highlights a highly diverse and competitive market. The area is already populated with a mix of street food vendors, coffee shops, fast food chains, and full-service restaurants.
This variety indicates not only strong demand but also layered consumer preferences, ranging from price-sensitive daily consumption to more premium dining experiences.
For Pondok Indah Mall 5, this means entering a market that is already mature, where differentiation will be key. Instead of simply adding more of the same, there is a clear opportunity to curate unique dining concepts, experiential F&B, or premium offerings that elevate the overall customer experience.
Meanwhile, the second image focuses on the retail landscape. Within the same 3 km radius, we see a wide range of retail categories already present, including clothing stores, skincare and beauty outlets, furniture shops, and other lifestyle retailers.
This signals that the area is not only a consumption hub for daily needs but also a destination for lifestyle and discretionary spending. The presence of these categories suggests that consumers in this area have both purchasing power and a preference for variety.
Figure 4: Point-of-interest (POI) mapping of F&B and retail establishments within the 3 km driving-mode catchment area surrounding PIM 5, South Jakarta.
From the visuals above, we can start to map out the commercial landscape surrounding Pondok Indah Mall 5, particularly within a 3 km radius. This gives us a grounded view of existing supply.
In the first image, the food and beverage category highlights a highly diverse and competitive market. The area is already populated with a mix of street food vendors, coffee shops, fast food chains, and full-service restaurants.
This variety indicates not only strong demand but also layered consumer preferences, ranging from price-sensitive daily consumption to more premium dining experiences.
For Pondok Indah Mall 5, this means entering a market that is already mature, where differentiation will be key. Instead of simply adding more of the same, there is a clear opportunity to curate unique dining concepts, experiential F&B, or premium offerings that elevate the overall customer experience.
Meanwhile, the second image focuses on the retail landscape. Within the same 3 km radius, we see a wide range of retail categories already present, including clothing stores, skincare and beauty outlets, furniture shops, and other lifestyle retailers.
This signals that the area is not only a consumption hub for daily needs but also a destination for lifestyle and discretionary spending. The presence of these categories suggests that consumers in this area have both purchasing power and a preference for variety.
Accessibility
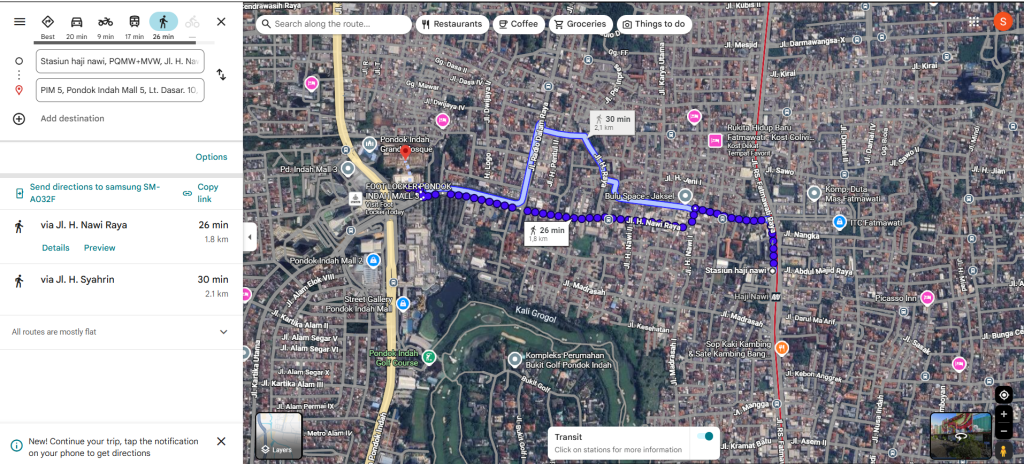 Figure 5: Transit proximity analysis based on travel time calculations from PIM 5 to Stasiun MRT Haji Nawi
In terms of accessibility, Pondok Indah Mall 5 is positioned in a highly strategic and well-connected area. The mall benefits from strong visibility, not only because of its location within the established Pondok Indah commercial cluster, but also due to its proximity to key public transportation nodes.
One of the main advantages is its closeness to the MRT Jakarta network, particularly Stasiun MRT Haji Nawi, which is only around 9 minutes away by motorcycle. This connection provides seamless access for daily commuters traveling from various parts of Jakarta, making it easier for visitors to integrate mall visits into their daily routines.
Figure 5: Transit proximity analysis based on travel time calculations from PIM 5 to Stasiun MRT Haji Nawi
In terms of accessibility, Pondok Indah Mall 5 is positioned in a highly strategic and well-connected area. The mall benefits from strong visibility, not only because of its location within the established Pondok Indah commercial cluster, but also due to its proximity to key public transportation nodes.
One of the main advantages is its closeness to the MRT Jakarta network, particularly Stasiun MRT Haji Nawi, which is only around 9 minutes away by motorcycle. This connection provides seamless access for daily commuters traveling from various parts of Jakarta, making it easier for visitors to integrate mall visits into their daily routines.
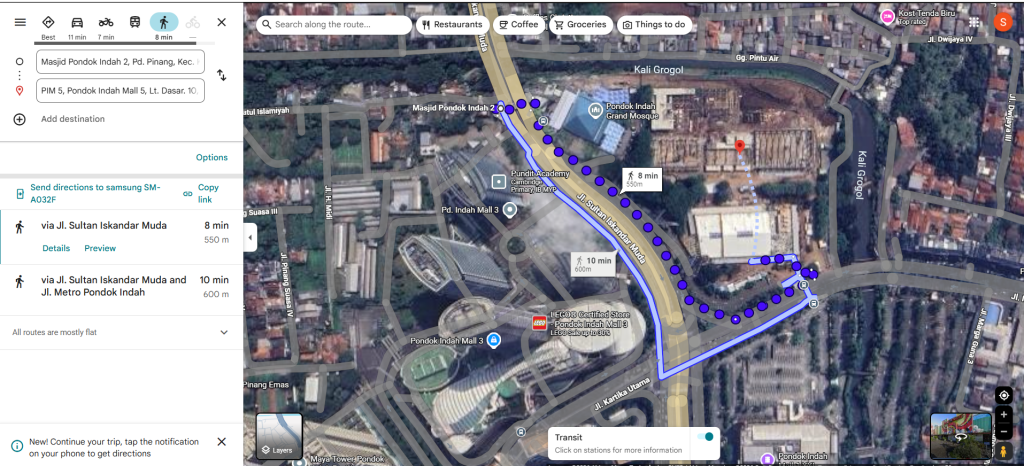 Figure 6: Transit proximity analysis based on travel time calculations from Halte Masjid Pondok Indah to PIM 5
In addition, the mall is also within walking distance of Halte Masjid Pondok Indah 2, approximately 8 minutes on foot. This further enhances accessibility for public transport users, particularly those relying on bus services.
With both MRT and bus connectivity within close reach, Pondok Indah Mall 5 is not only accessible for private vehicle users but also well-integrated into Jakarta’s growing public transportation ecosystem.
This level of accessibility increases footfall potential, supports consistent visitor flow throughout the day, and reinforces the mall’s positioning as a convenient and attractive destination for a wide range of consumers.
Figure 6: Transit proximity analysis based on travel time calculations from Halte Masjid Pondok Indah to PIM 5
In addition, the mall is also within walking distance of Halte Masjid Pondok Indah 2, approximately 8 minutes on foot. This further enhances accessibility for public transport users, particularly those relying on bus services.
With both MRT and bus connectivity within close reach, Pondok Indah Mall 5 is not only accessible for private vehicle users but also well-integrated into Jakarta’s growing public transportation ecosystem.
This level of accessibility increases footfall potential, supports consistent visitor flow throughout the day, and reinforces the mall’s positioning as a convenient and attractive destination for a wide range of consumers.
Visitor Volume & Dwell Time Across All Four PIMs
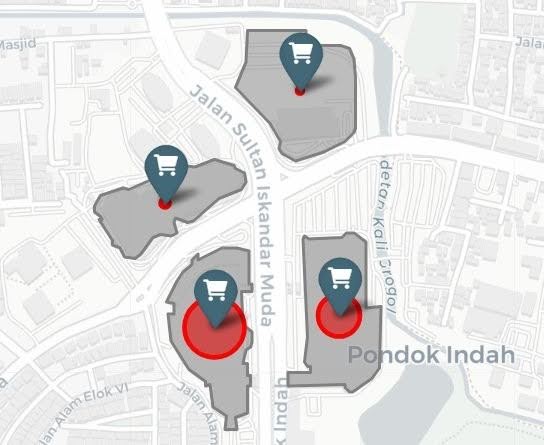 Figure 7: Spatial distribution map showing the size of devices recorded for all four Pondok Indah Malls along the Pondok Indah corridor, South Jakarta.
After analyzing the location fundamentals of Pondok Indah Mall 5, the next step is to understand how it compares with the existing Pondok Indah Mall ecosystem. By looking at all four malls, we can uncover differences in visitor volume and dwell time, which ultimately reflect how people interact with each destination.
The insights are derived from mobility data recorded in March 2026, during operational hours between 10:00 AM and 10:00 PM. This timeframe captures the mall’s peak activity window and provides a reliable view of real visitor behavior throughout the day.
The size of each circle represents the volume of recorded devices in that location, the larger the circle, the higher the visitor traffic, while smaller circles indicate fewer recorded devices and lower mobility activity.
Figure 7: Spatial distribution map showing the size of devices recorded for all four Pondok Indah Malls along the Pondok Indah corridor, South Jakarta.
After analyzing the location fundamentals of Pondok Indah Mall 5, the next step is to understand how it compares with the existing Pondok Indah Mall ecosystem. By looking at all four malls, we can uncover differences in visitor volume and dwell time, which ultimately reflect how people interact with each destination.
The insights are derived from mobility data recorded in March 2026, during operational hours between 10:00 AM and 10:00 PM. This timeframe captures the mall’s peak activity window and provides a reliable view of real visitor behavior throughout the day.
The size of each circle represents the volume of recorded devices in that location, the larger the circle, the higher the visitor traffic, while smaller circles indicate fewer recorded devices and lower mobility activity.
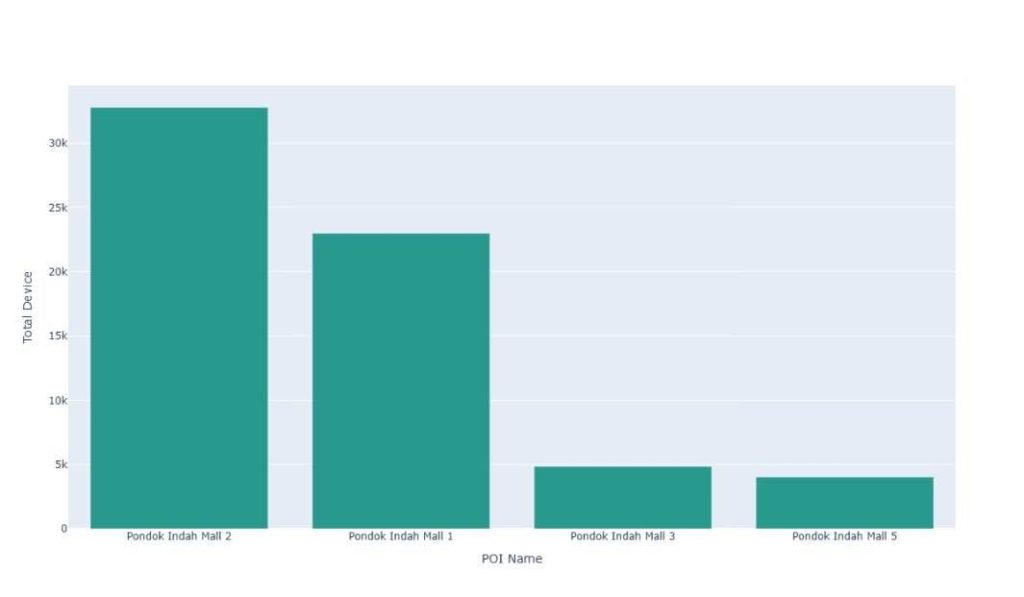 Figure 8: Total recorded devices across all four Pondok Indah Malls during March 2026 operational hours.
Among the four, Pondok Indah Mall 2 stands out as the busiest, with approximately 35,000 devices recorded. This suggests a strong and established draw, likely driven by a mature tenant mix and high consumer familiarity. On the other end, Pondok Indah Mall 5 shows fewer than 5000 devices, reflecting its early-stage position and the fact that it is still building awareness and traction within the market.
Figure 8: Total recorded devices across all four Pondok Indah Malls during March 2026 operational hours.
Among the four, Pondok Indah Mall 2 stands out as the busiest, with approximately 35,000 devices recorded. This suggests a strong and established draw, likely driven by a mature tenant mix and high consumer familiarity. On the other end, Pondok Indah Mall 5 shows fewer than 5000 devices, reflecting its early-stage position and the fact that it is still building awareness and traction within the market.
How Long Do Visitors Actually Stay?
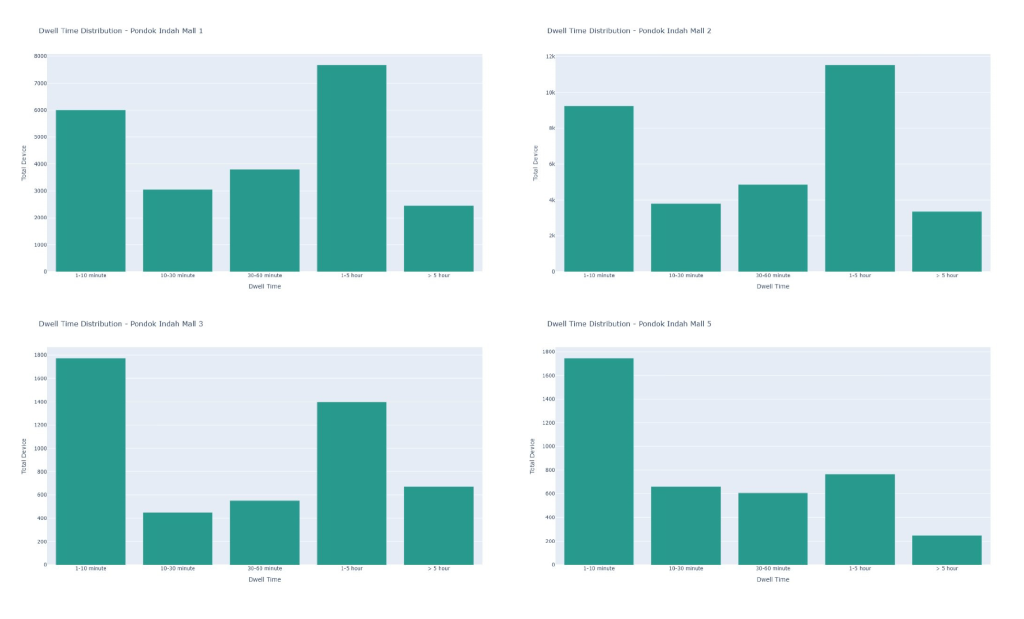 Figure 9: Dwell time distribution across all four Pondok Indah Malls based on mobility data recorded during operational hours.
However, visitor volume alone does not tell the full story. To truly understand how people engage with each mall, we need to look at dwell time, the amount of time a visitor actually spends inside the mall from the moment they arrive to the moment they leave. Dwell time is one of the most reliable indicators of visitor engagement, experiential quality, and ultimately, commercial performance.
Figure 9: Dwell time distribution across all four Pondok Indah Malls based on mobility data recorded during operational hours.
However, visitor volume alone does not tell the full story. To truly understand how people engage with each mall, we need to look at dwell time, the amount of time a visitor actually spends inside the mall from the moment they arrive to the moment they leave. Dwell time is one of the most reliable indicators of visitor engagement, experiential quality, and ultimately, commercial performance.
PIM 1
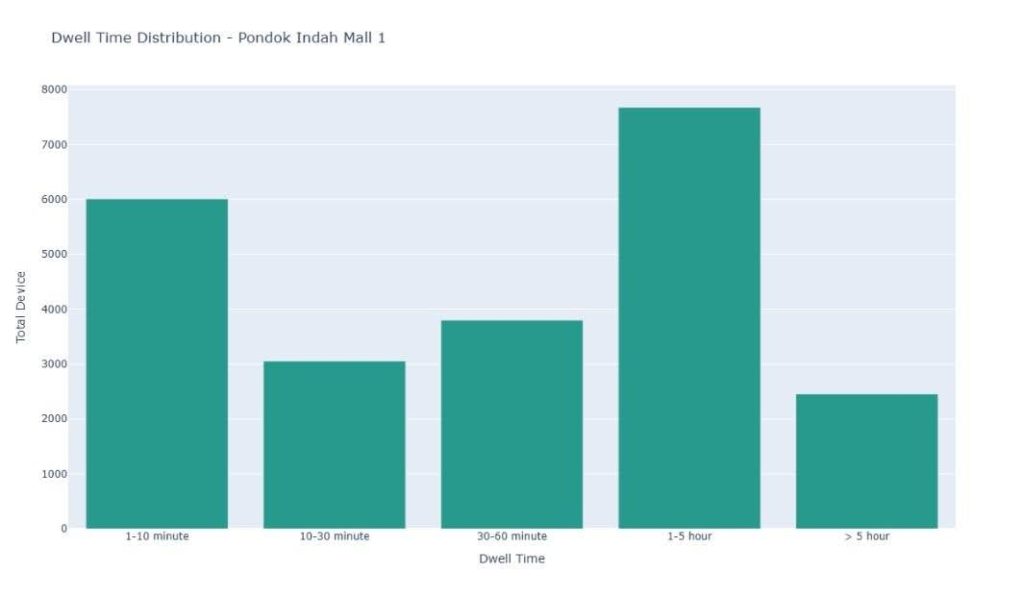 Figure 10: Dwell time distribution of Pondok Indah Mall 1.
Pondok Indah Mall 1 sets a clear benchmark for what a mature mall in this ecosystem looks like. The 1 to 5 hour segment is the dominant group at around 7,500 devices, followed by 1 to 10 minutes at almost 6,000, then 30 to 60 minutes at roughly 3,800, 10 to 30 minutes at around 3,000, and more than 5 hours as the smallest group at more than 2,000 devices. This distribution signals a well-established visitor base that comes with the intention to stay, browse, and engage rather than simply pass through.
Figure 10: Dwell time distribution of Pondok Indah Mall 1.
Pondok Indah Mall 1 sets a clear benchmark for what a mature mall in this ecosystem looks like. The 1 to 5 hour segment is the dominant group at around 7,500 devices, followed by 1 to 10 minutes at almost 6,000, then 30 to 60 minutes at roughly 3,800, 10 to 30 minutes at around 3,000, and more than 5 hours as the smallest group at more than 2,000 devices. This distribution signals a well-established visitor base that comes with the intention to stay, browse, and engage rather than simply pass through.
PIM 2
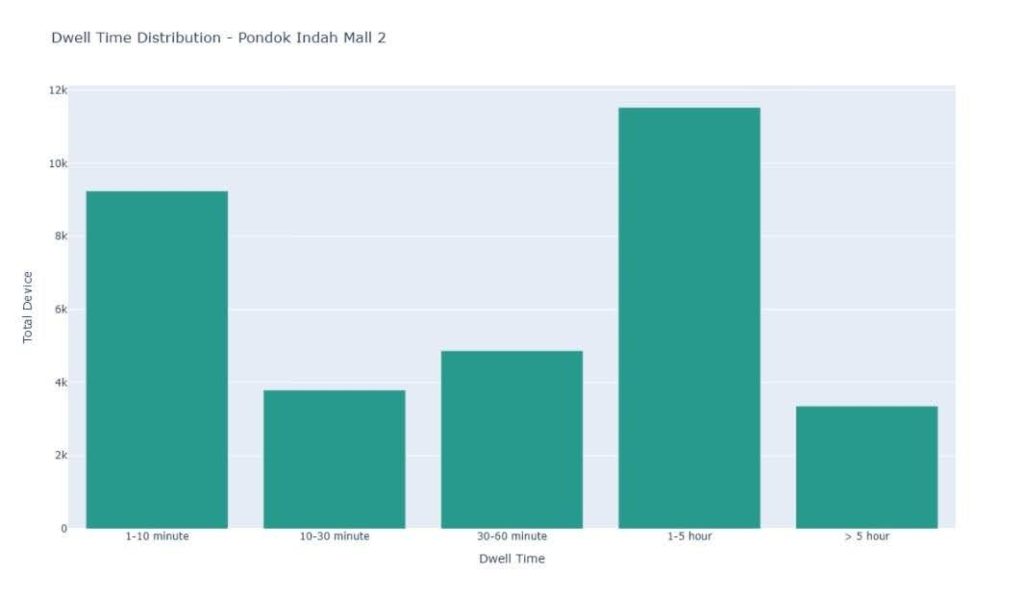 Figure 11: Dwell time distribution of Pondok Indah Mall 2.
Pondok Indah Mall 2 reinforces the pattern established by PIM 1, and takes it even further. It stands out as the highest-traffic mall in the ecosystem and the one with the most compelling dwell time profile across all four. The dominant segment is visitors staying 1 to 5 hours, recording approximately 11,000 devices, the single highest bar across all four charts.
This is immediately followed by the 1 to 10 minute segment at around 9,000 devices, then 30 to 60 minutes at roughly 5,000, and 10 to 30 minutes at less than 4,000. The smallest group is visitors staying more than 5 hours at approximately 3,000 devices.
Together, PIM 1 and PIM 2 reinforce the same core finding: the more established malls in the PIM ecosystem have successfully cultivated a visitor base that comes with the intention to stay. The dominance of the 1 to 5 hour segment across both is a strong indicator of tenant mix maturity and experiential depth.
Figure 11: Dwell time distribution of Pondok Indah Mall 2.
Pondok Indah Mall 2 reinforces the pattern established by PIM 1, and takes it even further. It stands out as the highest-traffic mall in the ecosystem and the one with the most compelling dwell time profile across all four. The dominant segment is visitors staying 1 to 5 hours, recording approximately 11,000 devices, the single highest bar across all four charts.
This is immediately followed by the 1 to 10 minute segment at around 9,000 devices, then 30 to 60 minutes at roughly 5,000, and 10 to 30 minutes at less than 4,000. The smallest group is visitors staying more than 5 hours at approximately 3,000 devices.
Together, PIM 1 and PIM 2 reinforce the same core finding: the more established malls in the PIM ecosystem have successfully cultivated a visitor base that comes with the intention to stay. The dominance of the 1 to 5 hour segment across both is a strong indicator of tenant mix maturity and experiential depth.
PIM 3
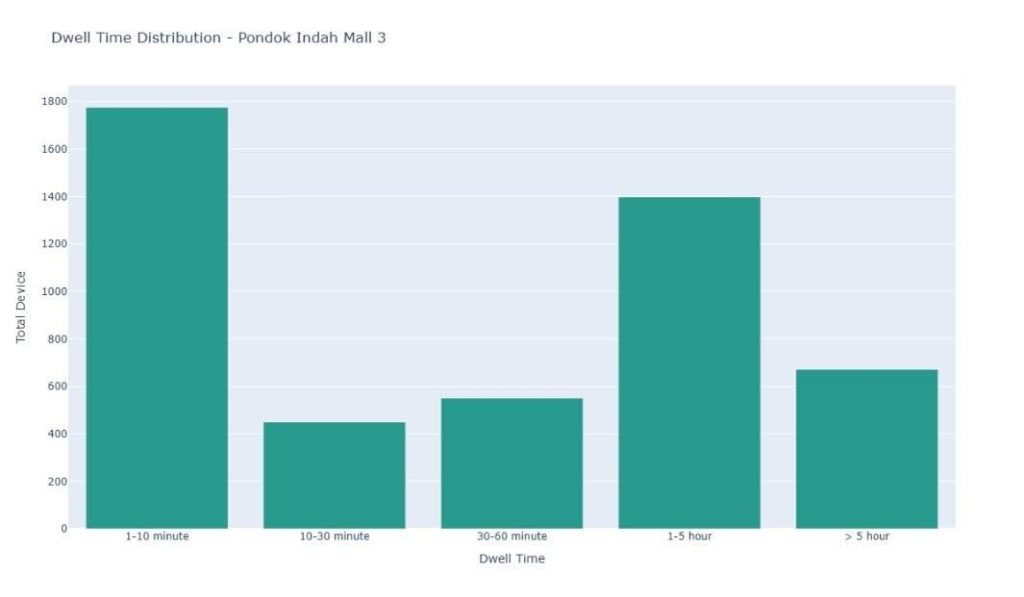 Figure 12: Dwell time distribution of Pondok Indah Mall 3.
Pondok Indah Mall 3 is where the pattern begins to shift, and this shift is meaningful. Unlike PIM 1 and PIM 2, the dominant dwell time segment at PIM 3 is 1 to 10 minutes, recording almost 1,800 devices, suggesting a higher proportion of brief, transactional, or pass-through visits. This is followed by 1 to 5 hours at around 1,400 devices, still a significant segment, but no longer the dominant one. More than 5 hours comes in third at approximately 650 devices, followed by 30 to 60 minutes at around 550, with 10 to 30 minutes as the smallest group at roughly 450 devices. This pattern suggests that PIM 3 attracts a meaningfully different visitor profile.
Figure 12: Dwell time distribution of Pondok Indah Mall 3.
Pondok Indah Mall 3 is where the pattern begins to shift, and this shift is meaningful. Unlike PIM 1 and PIM 2, the dominant dwell time segment at PIM 3 is 1 to 10 minutes, recording almost 1,800 devices, suggesting a higher proportion of brief, transactional, or pass-through visits. This is followed by 1 to 5 hours at around 1,400 devices, still a significant segment, but no longer the dominant one. More than 5 hours comes in third at approximately 650 devices, followed by 30 to 60 minutes at around 550, with 10 to 30 minutes as the smallest group at roughly 450 devices. This pattern suggests that PIM 3 attracts a meaningfully different visitor profile.
PIM 5
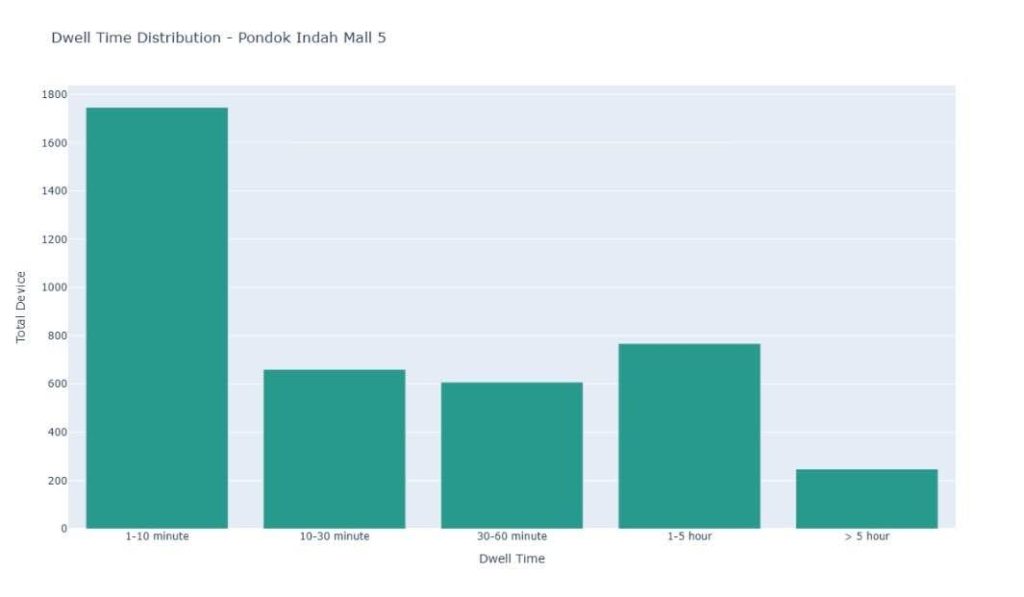 Figure 13: Dwell time distribution of Pondok Indah Mall 5.
Pondok Indah Mall 5, as the newest entry, presents its own distinct pattern that sets it apart from the rest of the ecosystem. The 1 to 10 minute segment leads at approximately 1,700 devices, followed by 1 to 5 hours at around 750 devices.
What makes PIM 5 unique is the middle range, 10 to 30 minutes, which comes in third at roughly 620 devices, closely followed by 30 to 60 minutes at approximately 600 devices, with more than 5 hours as the smallest group at around 250 devices.
Unlike PIM 3, where the 1 to 5 hour segment remains the clear second dominant group and more than 5 hours ranks third, PIM 5 shows a more evenly distributed middle range between the 10 to 30 minute and 30 to 60 minute segments, suggesting a visitor base that is still finding its rhythm with the mall, with a meaningful mix of both brief exploratory visits and moderately engaged ones.
Figure 13: Dwell time distribution of Pondok Indah Mall 5.
Pondok Indah Mall 5, as the newest entry, presents its own distinct pattern that sets it apart from the rest of the ecosystem. The 1 to 10 minute segment leads at approximately 1,700 devices, followed by 1 to 5 hours at around 750 devices.
What makes PIM 5 unique is the middle range, 10 to 30 minutes, which comes in third at roughly 620 devices, closely followed by 30 to 60 minutes at approximately 600 devices, with more than 5 hours as the smallest group at around 250 devices.
Unlike PIM 3, where the 1 to 5 hour segment remains the clear second dominant group and more than 5 hours ranks third, PIM 5 shows a more evenly distributed middle range between the 10 to 30 minute and 30 to 60 minute segments, suggesting a visitor base that is still finding its rhythm with the mall, with a meaningful mix of both brief exploratory visits and moderately engaged ones.
PIM Ecosystem at a Glance: Comparative Summary
The table below synthesizes the key behavioral and commercial dimensions across all four Pondok Indah Malls, providing a single reference view before the final assessment.| Mall | Visitor Volume (Mar 2026) | Dominant Dwell Time | Visitor Behavior Profile | Strategic Role |
| PIM 1 | ~22,000 devices | 1–5 hours | Extended lifestyle visits | Mature anchor destination |
| PIM 2 | ~35,000 devices | 1–5 hours | Deepest engagement, highest traffic | Ecosystem’s primary draw |
| PIM 3 | ~4,500 devices | 1–10 minutes | Pass-through / transactional | Convenience connector |
| PIM 5 | <5,000 devices (early stage) | 1–10 mins, shifting toward 1–5 hrs | Exploratory, destination behavior forming | Experience-led complement |