
Contents
National EV Charging Infrastructure Has Grown Sharply
The scale of growth is significant. Indonesia’s Ministry of Energy and Mineral Resources reported that public EV charging stations, known locally as SPKLU, had reached 4,892 units nationwide as of May 2026 (Otodriver). State utility PLN, which operates the majority of the network together with private partners, reported an even higher figure shortly after — 5,016 SPKLU units spread across 3,132 locations by June 2026. (Periskop.id) This is sustained acceleration. PLN and its partners deployed 4,655 charging units across Indonesia in 2025, a 44% increase from the 3,223 units operating in 2024. National targets call for approximately 62,000 SPKLU units by 2030. Usage is climbing alongside supply, with PLN’s leadership pointing to a sharp rise in SPKLU electricity consumption. Closing the gap between today’s ~5,000 operational units and the 62,000 target by 2030 will require massive capital deployment. Recognizing that state utilities cannot build this footprint alone, PLN introduced a commercial partnership model. This shifts the strategic opportunity to private developers, property managers, and retail operators who control high-value land assets.The Current National SPKLU Landscape: What the Map Shows
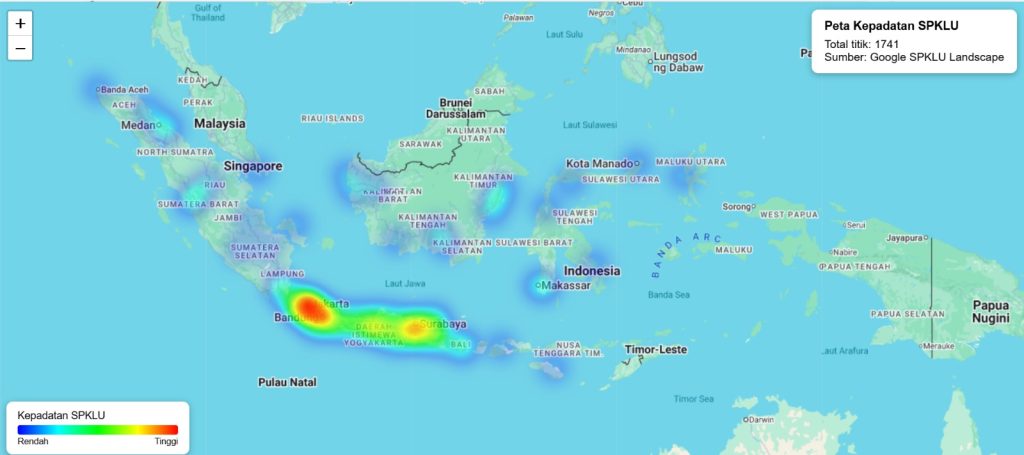
Plotting the national SPKLU network density makes one thing immediately obvious: charging infrastructure in Indonesia is heavily concentrated, not evenly spread. Outside of Java and Bali, most regions (Sumatra, Kalimantan, Sulawesi, Maluku, and Papua) show minimal density indicated by light blue patches across key urban hubs like Medan, Makassar, and Manado.
Java tells a completely different story. The map’s total count of 1,741 points is overwhelmingly dominated by Java, where density surges into high concentrations represented by orange and red heat zones. The Jakarta, Bandung belt forms the primary epicenter of infrastructure density, followed by strong secondary corridors extending through Yogyakarta, Surabaya, and into Bali.
In short: the national SPKLU map isn’t really a national story yet; it is a Java and Bali story, dominated heavily by the Greater Jakarta metro area. Understanding why the network concentrates this way matters more than the raw count.
Jabodetabek’s Location Pattern: EV Chargers Follow Dwell-Time, Not Just Drive-By Traffic
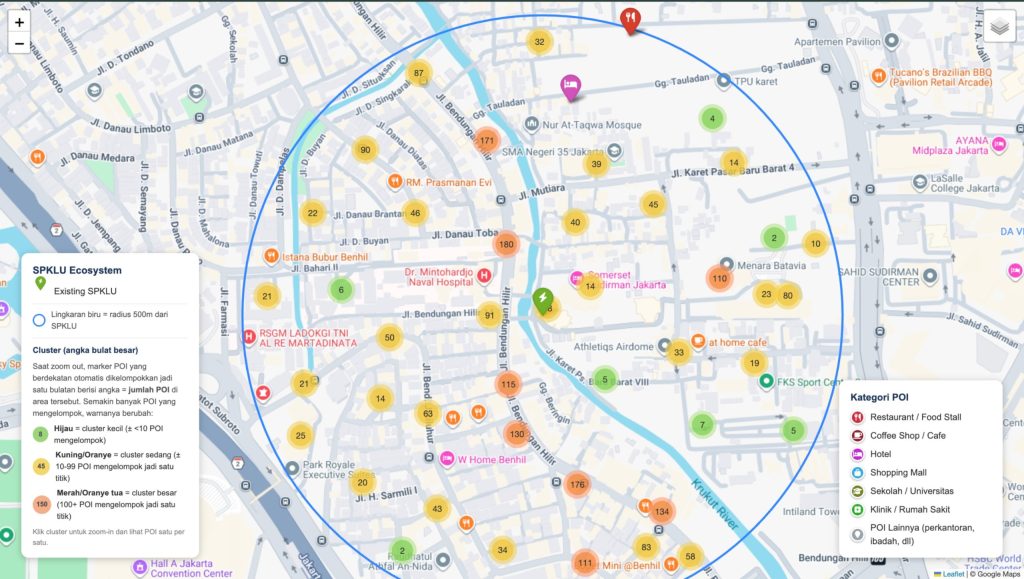
- F&B Destinations: Cafes, restaurants, and dining hubs, where charging aligns naturally with a 30–60 minute meal dwell time.
- Office & Commercial Districts: Workplaces where vehicles sit parked for 6–8 hours, optimal for standard AC charging.
- Retail & Lifestyle Centers: Malls and shopping centers, where charging complements leisure, entertainment, and errands.
- Transit & Parking Hubs: High-turnover transit nodes requiring ultra-fast DC charging solutions.
Why This Matters Beyond EV Charging
The strategic value of this analysis extends far beyond charging infrastructure. The exact geospatial analytics stack used to evaluate high-yield SPKLU sites—combining footfall movement, demographic catchment radiuses, and POI cluster density—is identical to the intelligence required for retail expansion, commercial real estate development, and asset valuation. Understanding where high-dwell foot traffic accumulates provides a universal commercial advantage across retail, real estate, and automotive infrastructure. Want to know more? Whether you’re planning your next EV charging site, scouting retail expansion opportunities, or evaluating real estate in Jabodetabek and beyond, this kind of location intelligence can sharpen the decision. Contact us via WhatsApp at 0877 7907 7750 or through Bvarta.com/contact-usReferences
- Bvarta internal geospatial dataset, national and Jabodetabek SPKLU location analysis, 13–16 June 2026