
Most ATM placement decisions still come down to gut feeling. A retail team sees a busy street corner, assumes foot traffic is high, and signs the lease. Sometimes it works. Often it doesn’t, and the machine sits underused for years while the lease payments keep coming.
A recent academic study on minimarkets in Bandar Lampung, Indonesia (Sumadana, 2026) offers a more disciplined way to think about this problem. It combines population density, road accessibility, and point of interest (POI) data into a single scoring system called spatial site profiling. We tested the same logic on LOKASI Intelligence to see how much of it a retailer could actually run themselves, and the answer is: most of it.
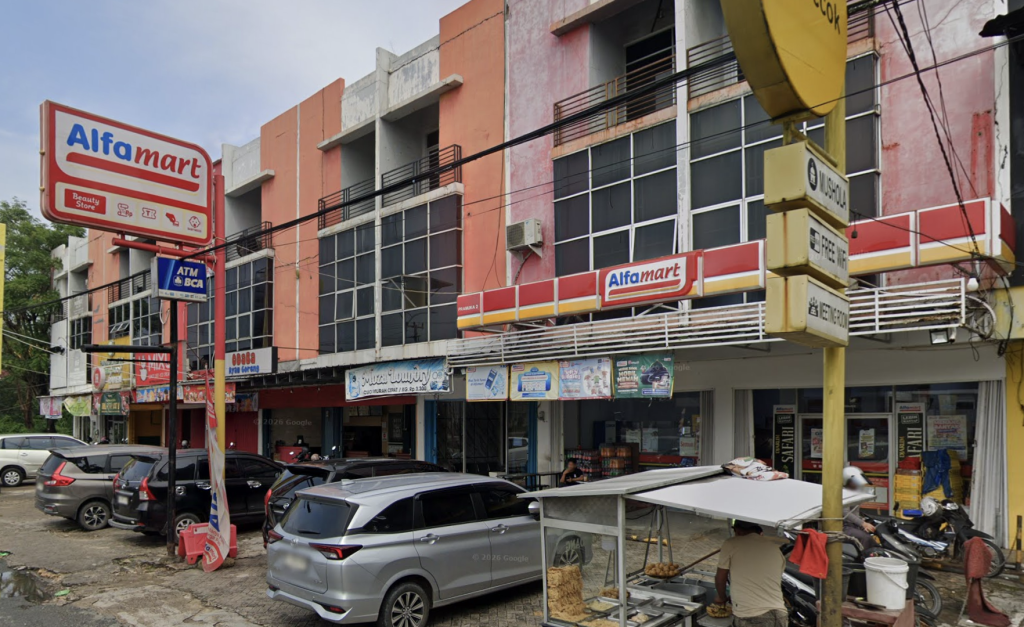
Figure 1: Minimarket and ATM access in an Indonesian urban retail corridor
Contents
- 1 Why ATM placement fails without spatial data
- 2 The site profiling framework: density, accessibility, and POI
- 3 Turning grid scores into a location decision
- 4 From analysis to action: ATM and marketing at the same location
- 5 A Shoutout to the Author of This Study
- 6 FAQ
- 6.1 What is spatial site profiling?
- 6.2 Can location intelligence software decide exactly where to build an ATM?
- 6.3 How is grid analysis different from just mapping POI points?
- 6.4 Does the same spatial data work for both ATM placement and marketing planning?
- 6.5 What data does LOKASI Intelligence use for mobility analysis?
- 7 References
Why ATM placement fails without spatial data
Financial institutions and retailers keep expanding ATM networks because cash transactions, even alongside digital payment growth, remain part of daily commerce in Indonesian cities. But not every location earns its keep.
The Bandar Lampung study lists the usual suspects behind a poorly performing ATM network:
- Low transaction intensity: the machine sits in a location with weak foot traffic, so utilization stays low.
- Uneven service coverage: some neighborhoods have several ATMs within a block while others have none.
- Unfocused marketing: promotions get spread across all outlets equally instead of concentrating on high potential zones.
- Conventional decision making: location choices rely on administrative boundaries or a manager’s intuition rather than measured demand.
None of these problems are visible until after the investment is made. That is the core argument for spatial analysis: it surfaces the mismatch between a location and its surrounding demand before the lease gets signed, not after.
The site profiling framework: density, accessibility, and POI
Spatial site profiling rests on three data layers that, together, describe how much financial activity a neighborhood can realistically support.
- Population density: more residents nearby means a larger pool of potential ATM users and minimarket shoppers.
- Accessibility: a location connected to a primary arterial road reaches more people than one buried in a residential side street (Safitri & Prarikeslan, 2024).
- Point of interest concentration: schools, hospitals, offices, and shopping centers pull in daily foot traffic that a nearby ATM or minimarket can capture.
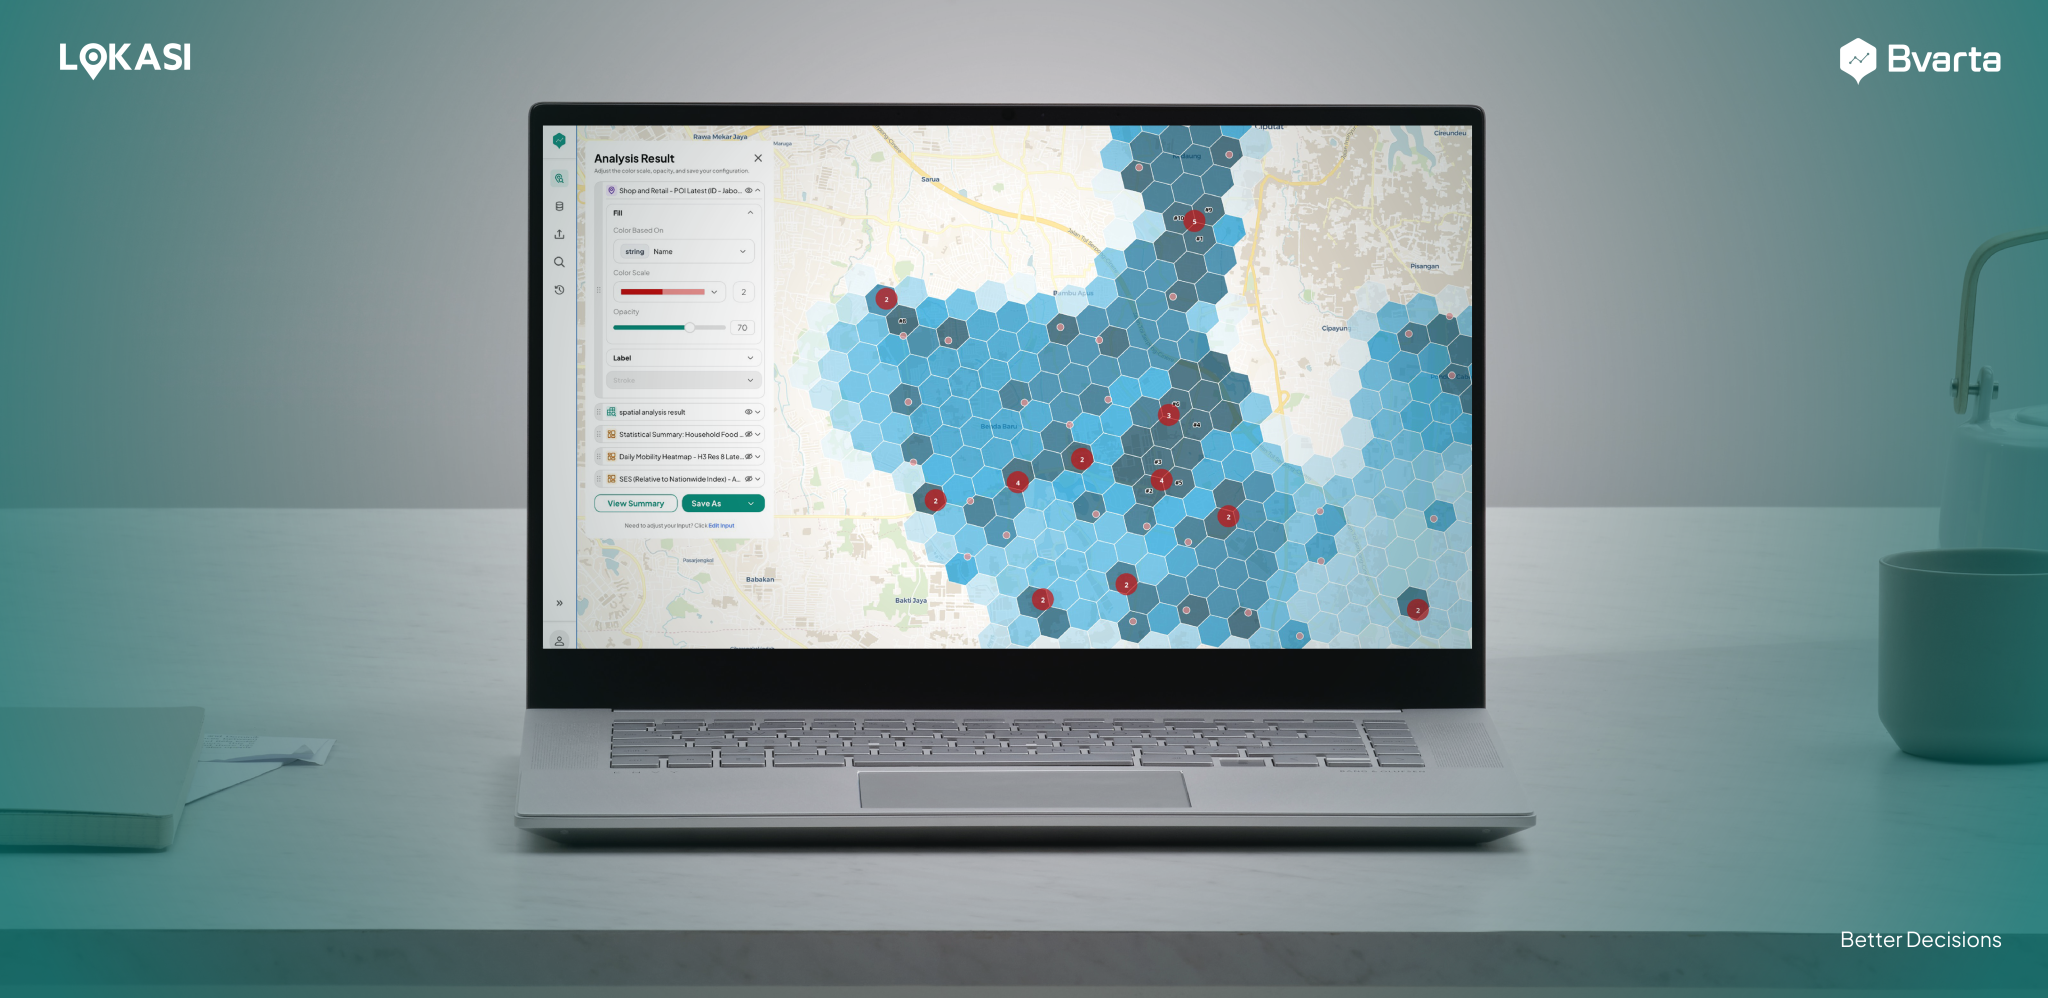
On LOKASI Intelligence, we pulled the Bank and Financial Institution POI dataset for Bandar Lampung and mapped every existing ATM and bank branch as clustered points. The pattern matched what the paper describes: ATMs concentrate heavily around the city center, with visible gaps in outlying districts. A 2021 study on minimarket distribution in Klaten found the same tendency, that retail outlets cluster where commercial activity is already high rather than spreading evenly across a city (Hidayah & Amin, 2021). That gap is exactly where a demand and supply mismatch tends to hide.
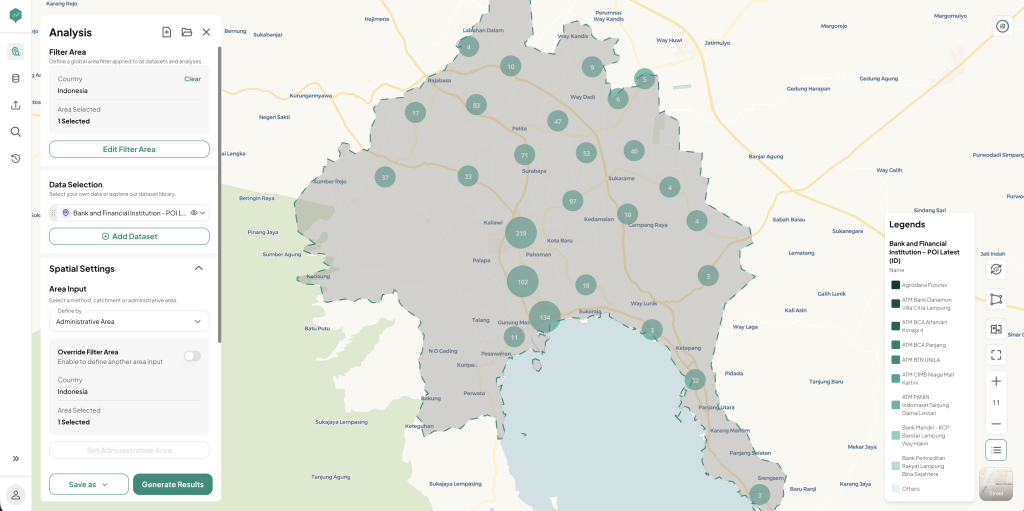
Figure 2: Bank and ATM POI clusters across Bandar Lampung, mapped in LOKASI Intelligence
Turning grid scores into a location decision
Raw density and POI counts are useful, but a retailer still needs a way to compare one neighborhood against another. This is where grid analysis comes in. The study divides the research area into uniform grid cells, then scores each cell by combining population density, POI concentration, and road accessibility into one number.
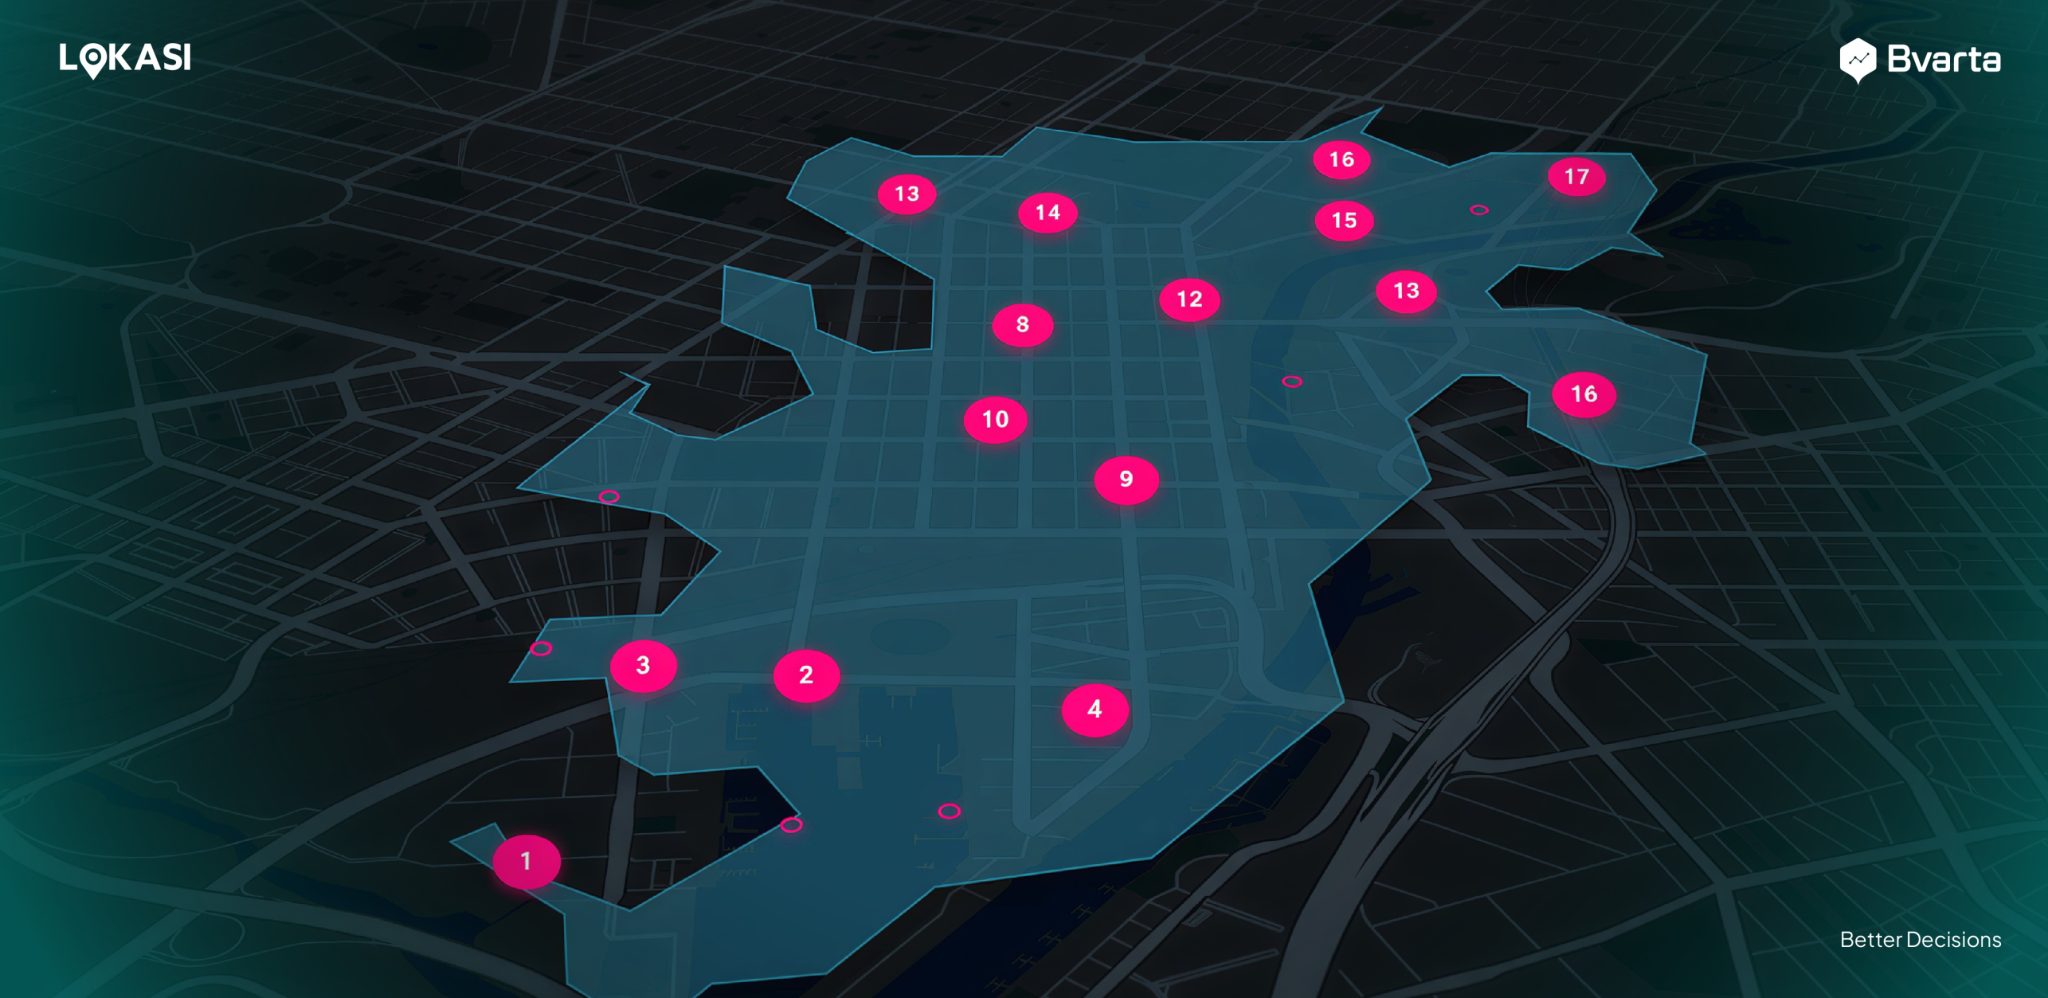
We replicated this directly. Using LOKASI Intelligence’s H3 hexagonal grid output, weighted scoring produced a ranked list of zones across Bandar Lampung, with scores normalized from 0 to 100. A handful of central hexagons scored far above the rest, a pattern consistent with the paper’s finding that trading corridors and dense residential pockets carry most of the city’s transaction potential.
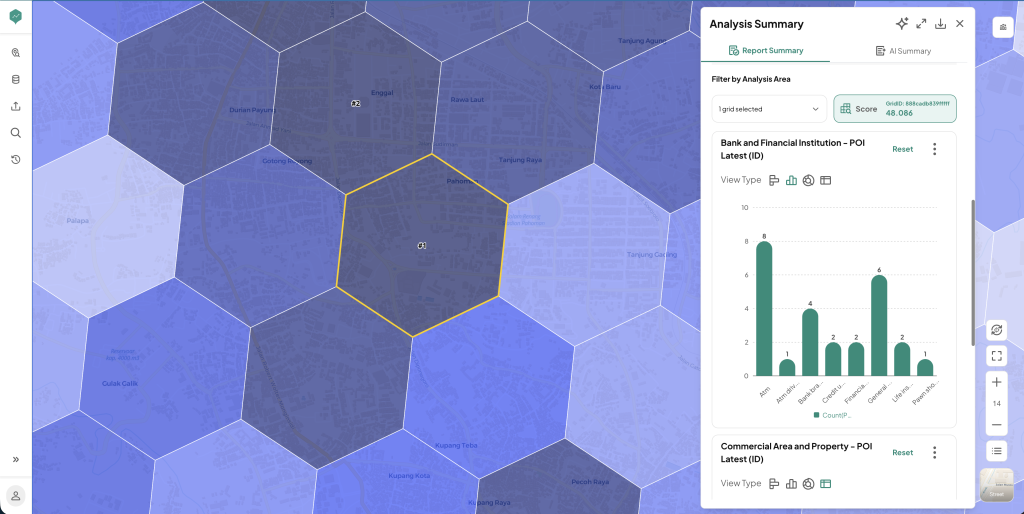 Figure 3: H3 grid scoring output showing top-ranked zones by potential in Bandar Lampung Using LOKASI Intelligence.
What the platform cannot do, and should not be asked to do, is make the final call. A grid score tells you which hexagons carry the highest theoretical potential. Whether to sign a lease in hexagon 3 instead of hexagon 5 still depends on rent, lease terms, competitor presence, and other business factors a scoring model does not see. Site profiling narrows the search. It does not replace the decision.
From analysis to action: ATM and marketing at the same location
One detail in the paper is easy to miss: the same spatial score that identifies a good ATM location also identifies a good marketing target. Both depend on the same underlying signal, which is how many people pass through a place and how often.
That overlap has a practical benefit. A retail team does not need two separate studies for finance and marketing. A single grid analysis, layered with mobility data, can flag zones where:
ATM placement makes sense: high density, strong accessibility, and existing POI clustering.
Marketing spend earns its keep: the same high-traffic zones where a promotion or in-store activation reaches the most people per rupiah spent.
On LOKASI Intelligence, this pairing works because the mobility heatmap layer is built from telecommunications analytics, giving a daily view of where people actually move through the city, not just where they live. Combined with the POI and grid layers, a retailer gets a working map of both financial and promotional opportunity without commissioning two separate studies.
Bvarta’s LOKASI Intelligence platform supports this workflow end to end: pulling POI, demographic, and mobility datasets, running H3 grid scoring, and testing road-based catchment areas around candidate sites. If your team is weighing where to place the next ATM or which minimarket branches deserve a marketing push, our analysts can walk through your specific coverage area on WhatsApp at 0877 7907 7750.
A Shoutout to the Author of This Study
This article draws on a GIS Consulting Project paper titled “Spatial Site Profiling untuk Optimalisasi Lokasi ATM dan Aktivitas Marketing pada Minimarket di Kota Bandar Lampung,” written by Muhammad Ammar Sumadana, a student in the Applied Bachelor’s Program in Geographic Information Systems, Department of Earth Technology, Vocational College, Universitas Gadjah Mada, with practitioner guidance from Bvarta. Thank you for putting together such a detailed and practical study. May it keep inspiring data-driven decision-making in Indonesian business.
FAQ
What is spatial site profiling?
It is a method that combines population density, road accessibility, and point of interest data to score how much business potential a location holds, instead of relying on intuition or administrative boundaries alone.
Can location intelligence software decide exactly where to build an ATM?
No. Tools like LOKASI Intelligence can score and rank locations by demand potential, but the final choice still depends on rent, lease terms, competition, and other business factors that sit outside the data.
How is grid analysis different from just mapping POI points?
POI mapping shows where existing activity is concentrated. Grid analysis goes further by dividing a city into uniform cells and scoring each one using multiple weighted variables, which makes it possible to compare areas that have no POI data at all.
Does the same spatial data work for both ATM placement and marketing planning?
Yes. Both decisions depend on the same underlying signal: how many people move through a location and how often. A single grid and mobility analysis can support both use cases.
What data does LOKASI Intelligence use for mobility analysis?
Mobility heatmaps on the platform are built from telecommunications analytics, giving a view of daily movement patterns across a city rather than static population counts alone.
References
Arifa, A.B. & Santoso, H., 2020. Sistem pendukung keputusan kelompok untuk penentuan usulan lokasi pendirian minimarket. Jurnal Teknik Komputer, 6(2), pp.219-226. Available at: ejournal.bsi.ac.id
Hidayah, B. & Amin, C., 2021. Analisis pola spasial dan faktor pemilihan lokasi minimarket di Kabupaten Klaten. Media Komunikasi Geografi, 22(2), pp.171-182. Available at: doi.org/10.23887/mkg.v22i2.36806
Imaarah, A. & Yulfa, A., 2024. Persebaran minimarket dalam analisis spasial dan faktor-faktor yang mempengaruhinya di Kecamatan Padang Barat. YASIN: Jurnal Analisis Sistem dan Pendidikan, 4(5), pp.844-858. Available at: ejournal.yasin-alsys.org
Safitri, D.D. & Prarikeslan, W., 2024. Analisis pola sebaran minimarket berdasarkan karakteristik lokasi di Kota Bukittinggi. Jurnal Pendidikan Tambusai, 8(3), pp.41525-41539.
Sumadana, M.A., 2026. Spatial Site Profiling untuk Optimalisasi Lokasi ATM dan Aktivitas Marketing pada Minimarket di Kota Bandar Lampung. GIS Consulting Paper, Sarjana Terapan Sistem Informasi Geografis, Sekolah Vokasi, Universitas Gadjah Mada.