
Contents
The Merchandising Paradox: More Outlets, Same Blind Spots
When merchandising budgets get allocated, the default approach at most FMCG organizations is experience-based territory management. Sales reps cover their existing beat, distributors nominate outlets they already have relationships with, and trade marketing teams greenlight investment in outlets that show up favorably in last quarter’s sales report. It is a reasonable way to run day-to-day operations, since it minimizes disruption and leans on relationships that already work. The problem shows up at the portfolio level. A 2018 study published in the journal Sustainability modeled FMCG consumer demand across geographic grid cells in Guiyang, China, and found that demand was not evenly spread, it was spatially correlated. Demand in one grid cell was connected to demand in neighboring cells, and retailers who adjusted purchasing and stocking strategy according to that spatial pattern, rather than relying on historical sales alone, saw theoretical sales improve by more than 6 to 10 percent depending on the strategy applied. In other words, the outlets worth investing in are not always the ones already generating revenue. Sometimes they are the ones sitting just outside the current radius of attention, inside a grid cell with strong latent demand that historical sales data alone would never surface. For an FMCG brand operating across GT and MT in Indonesia, that gap compounds. With millions of general trade outlets and a fast-growing modern trade footprint, the outlets a brand currently serves are a small, non-random sample of the outlets that exist. Relying on that sample alone to decide where to expand merchandising investment means the blind spot from the previous cycle gets carried straight into the next one.What “Merchandising Potential” Actually Means in Spatial Terms
To talk about merchandising potential precisely, it helps to define a few things clearly.- White Space: an area, typically a grid cell or sub-district zone, where demand indicators are strong, population, spending capacity, category-relevant POI density, but the brand’s own sales or distribution presence is weak, absent, or clearly underperforming compared to similar areas nearby.
- POI Data (GT & MT): a structured, geolocated dataset of general trade and modern trade points of interest, warungs, kios, and toko kelontong on one end, minimarkets, supermarkets, and hypermarkets on the other, categorized by type and estimated scale.
- Grid Analysis: dividing a market into uniform cells, commonly H3 hexagons, and scoring each cell on demand and opportunity indicators, rather than analyzing at district or provincial level where local variation gets smoothed over and individual outlets become invisible.
- Merchandising Potential: an outlet-level score that combines local demand density, category competition, and accessibility, used to rank individual GT and MT outlets once a white space area has already been flagged, rather than treating an entire district as a single investment decision.
How White Space Analysis and Grid Analysis Work Together
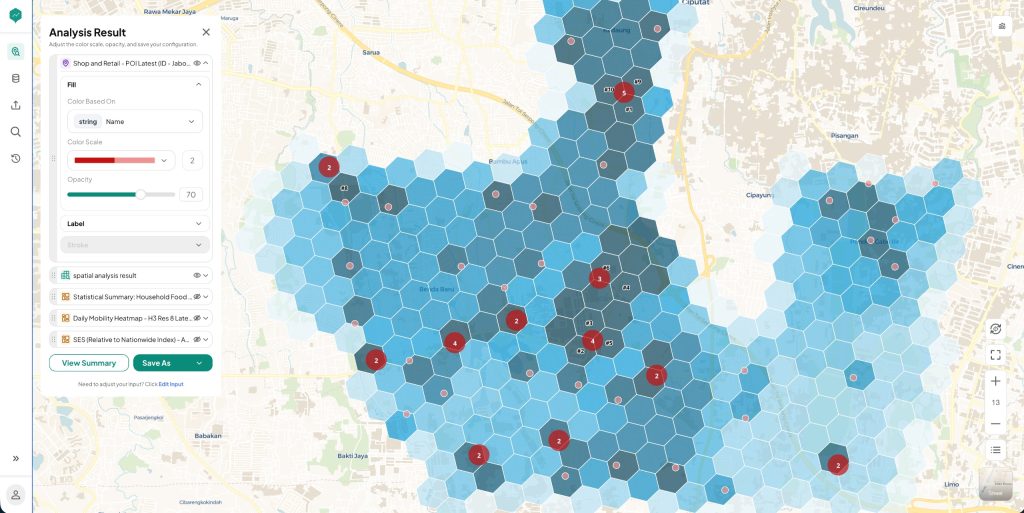 Figure 1: White Space Analysis of POI, Mobility and SES.
Combining internal sales data with GT and MT POI data is what makes white space analysis possible in the first place. Layer where a brand already sells against the full universe of general trade and modern trade outlets in a target area, along with demand indicators like population and spending capacity, and the areas where demand and POI presence are strong but the brand’s own footprint is thin start to stand out on their own. That is the first read: broad zones of untapped merchandising potential.
A flagged area on its own isn’t something a trade marketing team can act on directly, though. A promising sub-district might contain hundreds of GT and MT outlets, and only a fraction of them are actually worth prioritizing. This is where grid analysis adds precision. Breaking that same area down into a fine grid, commonly H3 hexagons, and scoring the individual outlets inside each cell based on local demand density and competitive presence turns a broad area recommendation into a specific, outlet-level shortlist.
Put together, the two methods answer two different questions in sequence. White space analysis, built on internal sales data layered against GT and MT POI data, answers where the untapped potential roughly is. Grid analysis, applied on top of that same POI data, answers which specific stores inside that area are worth the merchandising investment. On LOKASI Intelligence, both steps run on the same retail POI dataset, general trade and modern trade in one source, so a brand isn’t reconciling area-level and outlet-level data from separate vendors along the way.
Figure 1: White Space Analysis of POI, Mobility and SES.
Combining internal sales data with GT and MT POI data is what makes white space analysis possible in the first place. Layer where a brand already sells against the full universe of general trade and modern trade outlets in a target area, along with demand indicators like population and spending capacity, and the areas where demand and POI presence are strong but the brand’s own footprint is thin start to stand out on their own. That is the first read: broad zones of untapped merchandising potential.
A flagged area on its own isn’t something a trade marketing team can act on directly, though. A promising sub-district might contain hundreds of GT and MT outlets, and only a fraction of them are actually worth prioritizing. This is where grid analysis adds precision. Breaking that same area down into a fine grid, commonly H3 hexagons, and scoring the individual outlets inside each cell based on local demand density and competitive presence turns a broad area recommendation into a specific, outlet-level shortlist.
Put together, the two methods answer two different questions in sequence. White space analysis, built on internal sales data layered against GT and MT POI data, answers where the untapped potential roughly is. Grid analysis, applied on top of that same POI data, answers which specific stores inside that area are worth the merchandising investment. On LOKASI Intelligence, both steps run on the same retail POI dataset, general trade and modern trade in one source, so a brand isn’t reconciling area-level and outlet-level data from separate vendors along the way.