
Two retail locations can have nearly identical foot traffic counts and still produce very different sales. The difference often comes down to something foot traffic alone cannot measure: how much spending power is actually walking past.
This is the gap that socioeconomic status (SES) data is meant to close. It tells retailers not just how many people are in an area, but roughly how much they can spend, and on what kind of products.
This article explains what SES data is, why it matters more than raw population counts, and how retailers use it in practice, and what a real catchment comparison looks like
Contents
What Is SES Data
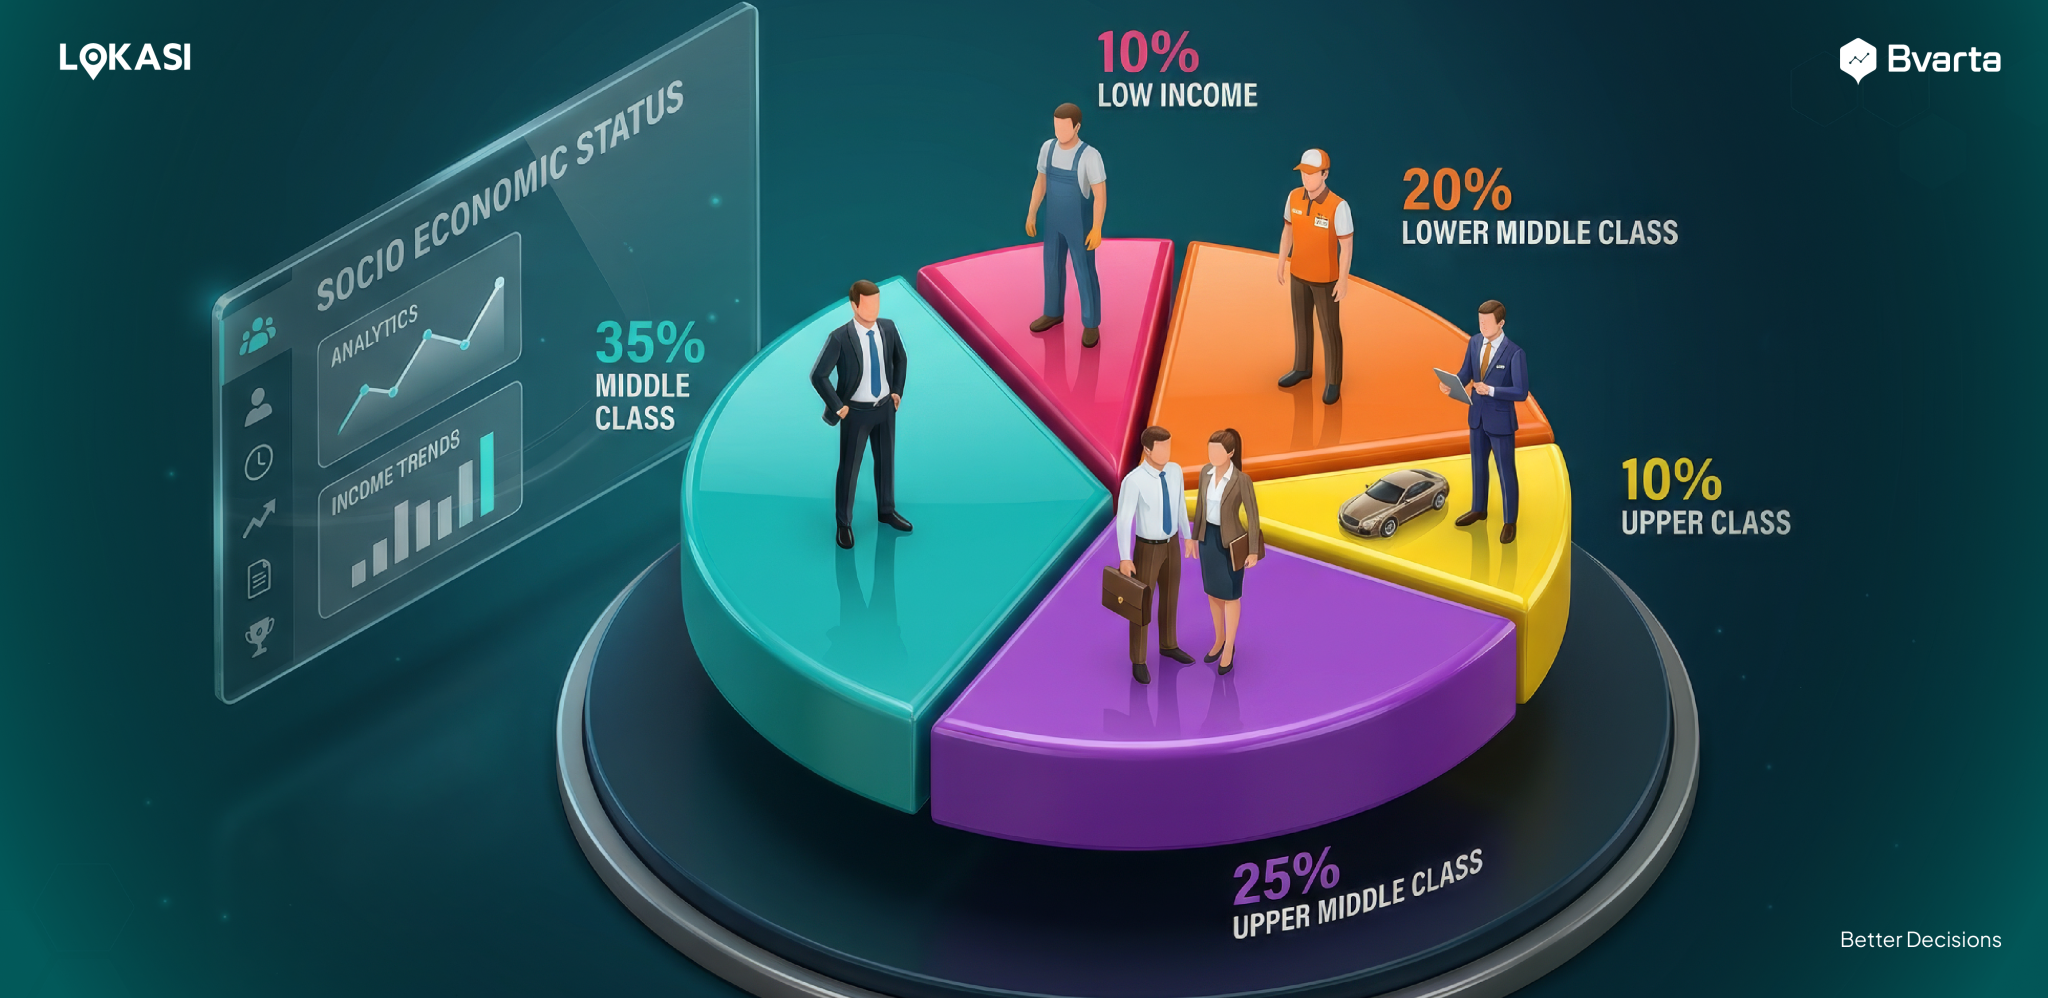
Socioeconomic status data classifies a population into tiers based on income, expenditure, or a combination of asset and consumption indicators. In market research, SES classification is most commonly built from household income and expenditure surveys, which are then used to group an area’s population into bands typically ranging from lower to upper class.
This methodology is well established in the region. Market research bodies across the region have standardized SES classification using national income and expenditure census data, then applying statistical transformation to group households into consistent tiers that can be compared across regions.
Why It Matters More Than Raw Population
Population counts treat every resident as equally valuable to a business, which is rarely true in retail. SES data corrects for this by showing how much economic weight actually sits behind a given population figure.
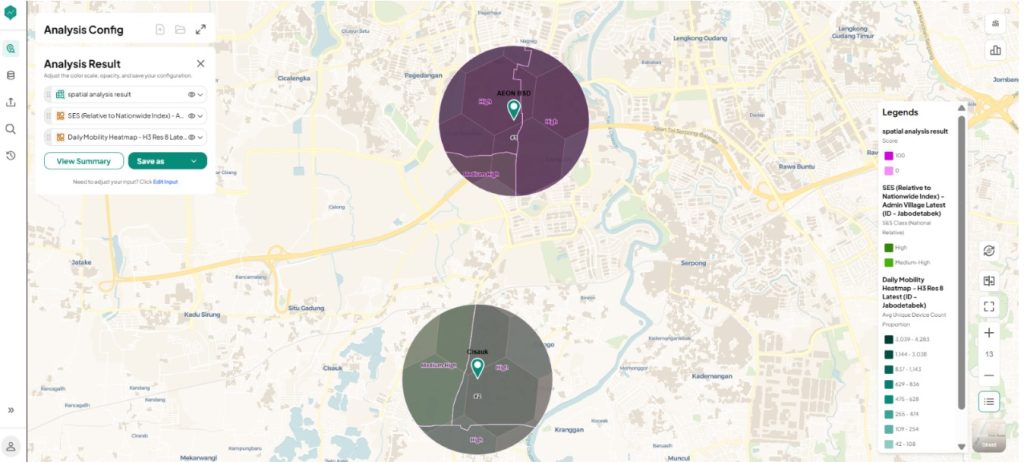
A quick illustration: imagine two candidate sites for a mid-market grocery format.
| Catchment A | Catchment B | |
| Population (1km radius) | 42,000 | 27,000 |
| Dominant SES tier | High | High |
| Estimated monthly F&B spend per household | Baseline | ~40% higher |
| Estimated total catchment spending power | Lower | Higher, despite fewer people |
Catchment B has 36% fewer residents than Catchment A, but a higher concentration of upper-tier households. This results in significantly higher total addressable spend for a mid-market grocery format. A site-selection process relying strictly on headcount would incorrectly rank Catchment A higher.
Beyond total spend, SES data shapes decisions in three other ways:
- Spending composition: SES data is often paired with expenditure splits, showing how much of a population’s spending goes toward food versus non-food categories, which directly informs what kind of retail format and tenant mix will perform best.
- Brand positioning fit: a premium brand opening in a predominantly lower SES area is fighting an uphill battle no matter how strong its foot traffic numbers look.
- Household Size & Density Nuance: High-density, lower-SES areas can dilute average spend per transaction, whereas moderate-density, high-SES areas often yield higher average basket sizes.
How Retailers Use It in Practice
SES data shows up across several retail decisions:
- Format and positioning: deciding whether a location supports a premium, mid-market, or value format based on the dominant SES tier nearby.
- Tenant mix planning: for malls and shopping centers, SES data helps curate a tenant mix that matches what the surrounding population can actually afford and is likely to want.
- Pricing and assortment: adjusting price points and product assortment by location, rather than applying one national pricing strategy across very different SES profiles.
- Leasing negotiations: using SES and expenditure data as evidence when negotiating lease terms, since a verified high-spending catchment strengthens a retailer’s position.
SES Data vs. Foot Traffic: Why You Need Both
Foot traffic and SES data answer two different questions, and confusing them is one of the most common site-selection mistakes:
- Foot traffic answers: “How many people pass this location, and when?”
- SES data answers: “How much of what they spend could realistically come to my store?”
A location can have heavy foot traffic that’s mostly commuters passing through on a fixed budget, or light foot traffic from a smaller but high-spending residential catchment. Neither metric alone tells the full story. A high-traffic, low-SES site can underperform a lower-traffic, high-SES one for a mid-market or premium format. In practice, foot traffic should be used to confirm a location is physically accessible and visible, while SES data is used to confirm the people passing through can actually afford what’s being sold. Treating the two as substitutes rather than complements is where site-selection models go wrong most often.
Common Pitfalls Retailers Should Watch For
- Applying one national pricing or format strategy everywhere. A format that works in a high SES catchment can underperform or overperform badly in a medium or low SES; SES data is only useful if pricing and assortment are actually adjusted per catchment, not just reviewed.
- Using city- or district-level SES averages for a single-site decision. A whole district can be mixed-SES; the relevant number is the tier distribution within the immediate catchment radius, not the city average.
- Treating SES tier as static. Catchments shift as new housing, transit lines, or competing developments come in. SES data tied to current mobility and demographic patterns is more reliable than a one-time snapshot.
- Ignoring spending composition. Two catchments with the same overall SES tier can still differ sharply in food vs. non-food spend, which matters more for tenant mix and category planning than the tier label alone.
Get a Clearer Spending Picture With LOKASI
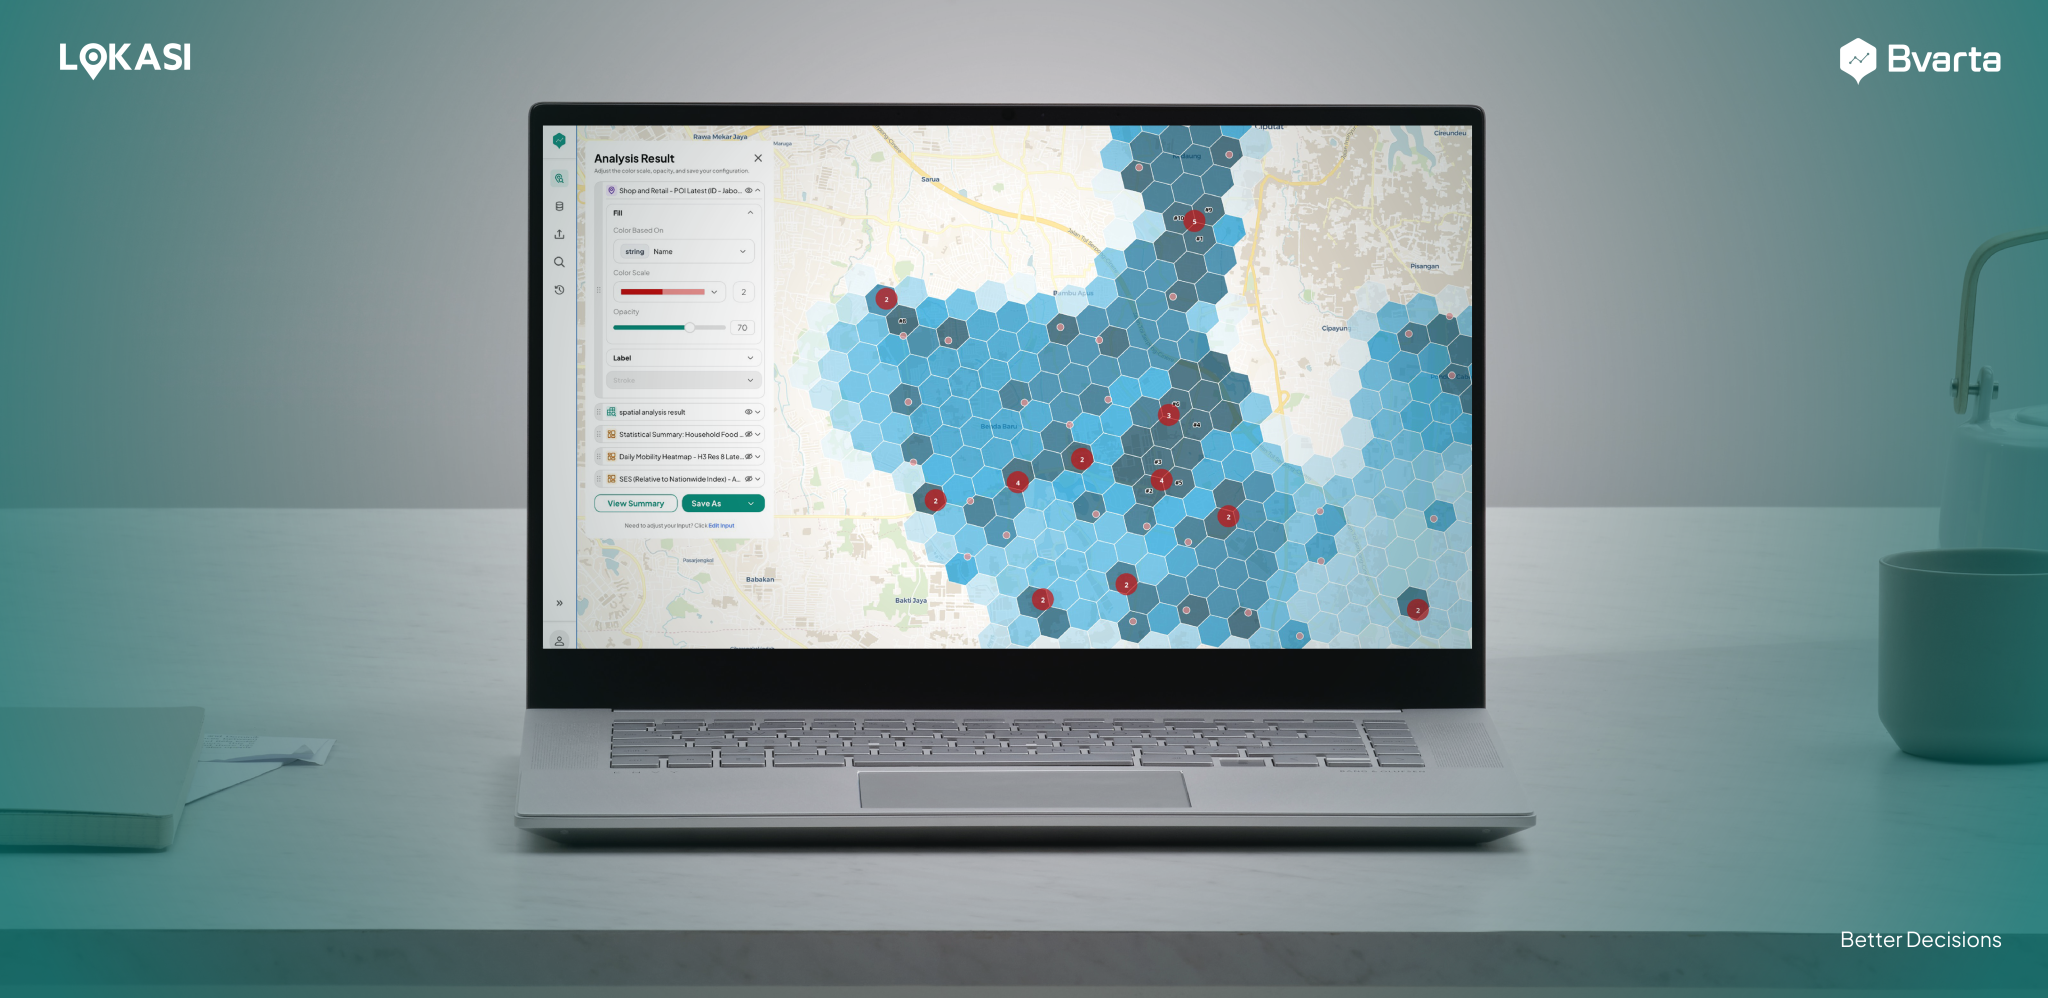
LOKASI Intelligence layers SES classification on top of demographic, mobility, and competitor data, giving retailers a view of not just how many people are near a location, but how much spending power actually sits within that catchment, refreshed against current mobility and demographic patterns rather than static census snapshots.
Want to see how your next candidate site scores? Reach out for a free consultation via WhatsApp at 0877 7907 7750 or through bvarta.com/contact-us.
FAQ
What is SES data in retail site selection?
SES data classifies a population by socioeconomic tier based on income or expenditure, showing how much spending power exists in an area rather than just how many people live there.
Why is SES data more useful than population data alone?
Two areas can have similar population sizes but very different spending capacity. SES data captures that difference, which directly affects what kind of retail format and tenant mix will succeed there.
How does LOKASI provide SES data?
LOKASI layers SES classification together with demographic, mobility, and competitor data, giving retailers a combined view of population, spending power, and competitive density for any candidate location.
References
Department of Marketing, Assumption University. (2018). Standardization of socio-economic status (SES) classification in Thailand market research industry. http://www.marketing.au.edu/our-department/kms/440-standardization-of-socio-economic-status-ses-classification-in-thailand-market-research-industry.html