
Ask most retail teams how they define a store’s market, and the answer is usually a number followed by “kilometer radius.” It is a fast way to talk about coverage, but it is rarely an accurate one.
Real customers do not arrive in a perfect circle. They follow roads, avoid traffic, and stop at whichever store sits along their actual route. A catchment area built on a simple radius can overstate or understate demand in ways that only become obvious after the lease is signed.
This article explains what catchment area analysis actually measures, and why getting it wrong is one of the costliest mistakes in retail expansion.
Contents
What Is a Catchment Area
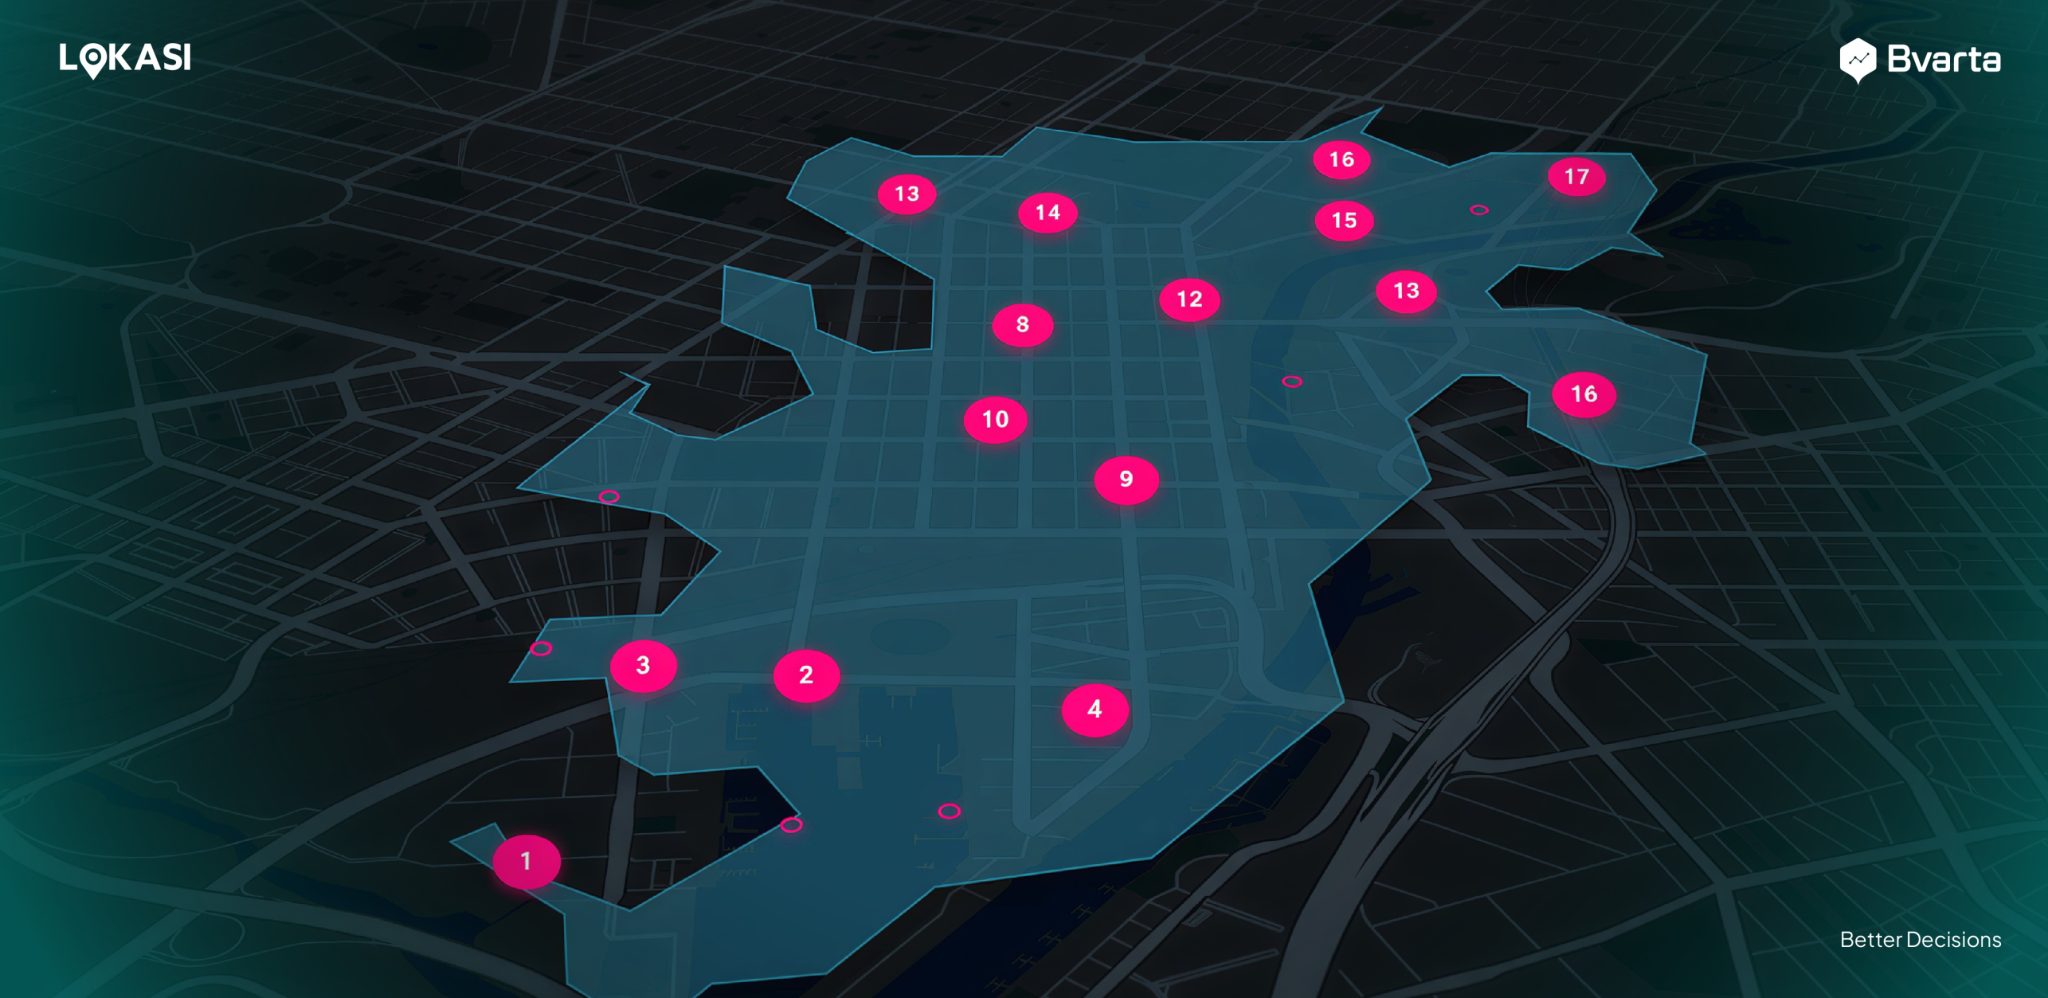
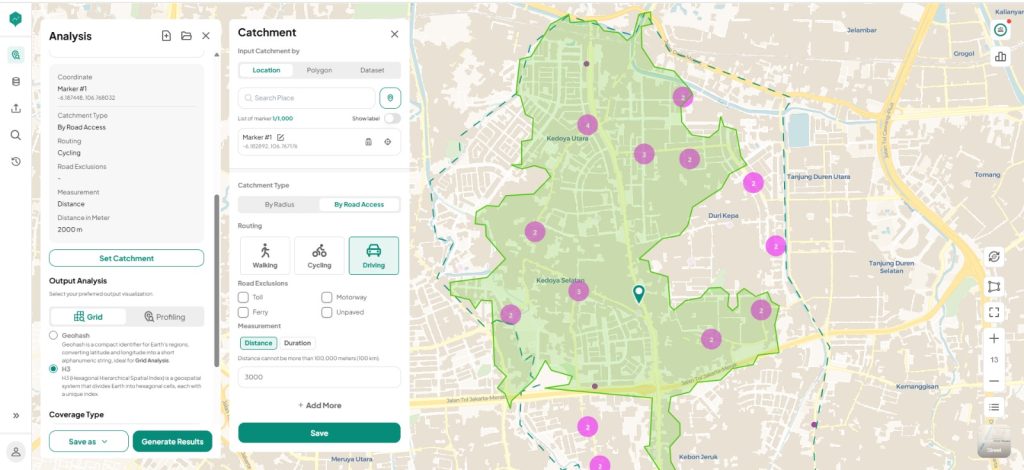
A catchment area is the geographic zone from which a business realistically draws the majority of its customers. The more accurate version of this is built as an isochrone: a boundary shaped by actual driving, motorcycle, or walking time along the real road network, rather than a uniform circle drawn around a point.
This distinction matters because road networks are rarely symmetrical. A location next to a river, a one-way system, or a major intersection can have a catchment area that looks more like an irregular shape than a circle, reaching farther in some directions and falling well in others.
Why a Wrong Estimate Is Costly
When a catchment area is overestimated, retailers end up reading far more demand into a location than actually exists, which leads to overly optimistic revenue projections and, eventually, an underperforming store.
When it is underestimated, the opposite happens: a genuinely strong location gets passed over because the simplified radius made it look smaller than it really is,
Getting the catchment area wrong also distorts decisions beyond the first store. Retailers that rely on a fixed radius rule when expanding a network risk one of two outcomes: opening new branches too close together, where the new catchment area significantly overlaps an existing store’s actual trade area, or opening too far apart and leaving real demand uncovered in between. Trade area overlap is exactly what cannibalization analysis is meant to catch. According to PassBy’s site selection research, most retailers set a maximum acceptable overlap of around 15 to 30 percent before a new site is considered too risky relative to an existing one, below 15% is generally treated as safe, and above 30% should trigger serious scrutiny.
How It Works in Practice
A proper catchment area analysis layers several data sources on top of the road-network boundary:
- Socioeconomic status (SES) data: showing the spending capacity of the population inside the catchment, not just its size.
- Mobility data: Capturing how people actually move through the area, including commuters and visitors who may not be registered residents.
- Competitor POI as a negative parameter: reducing the attractiveness score of cells that already sit close to strong competitor presence.
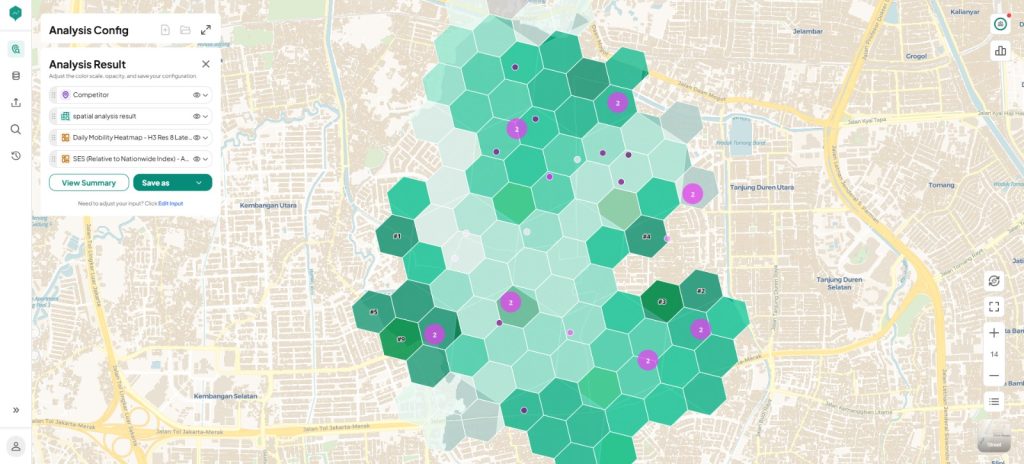
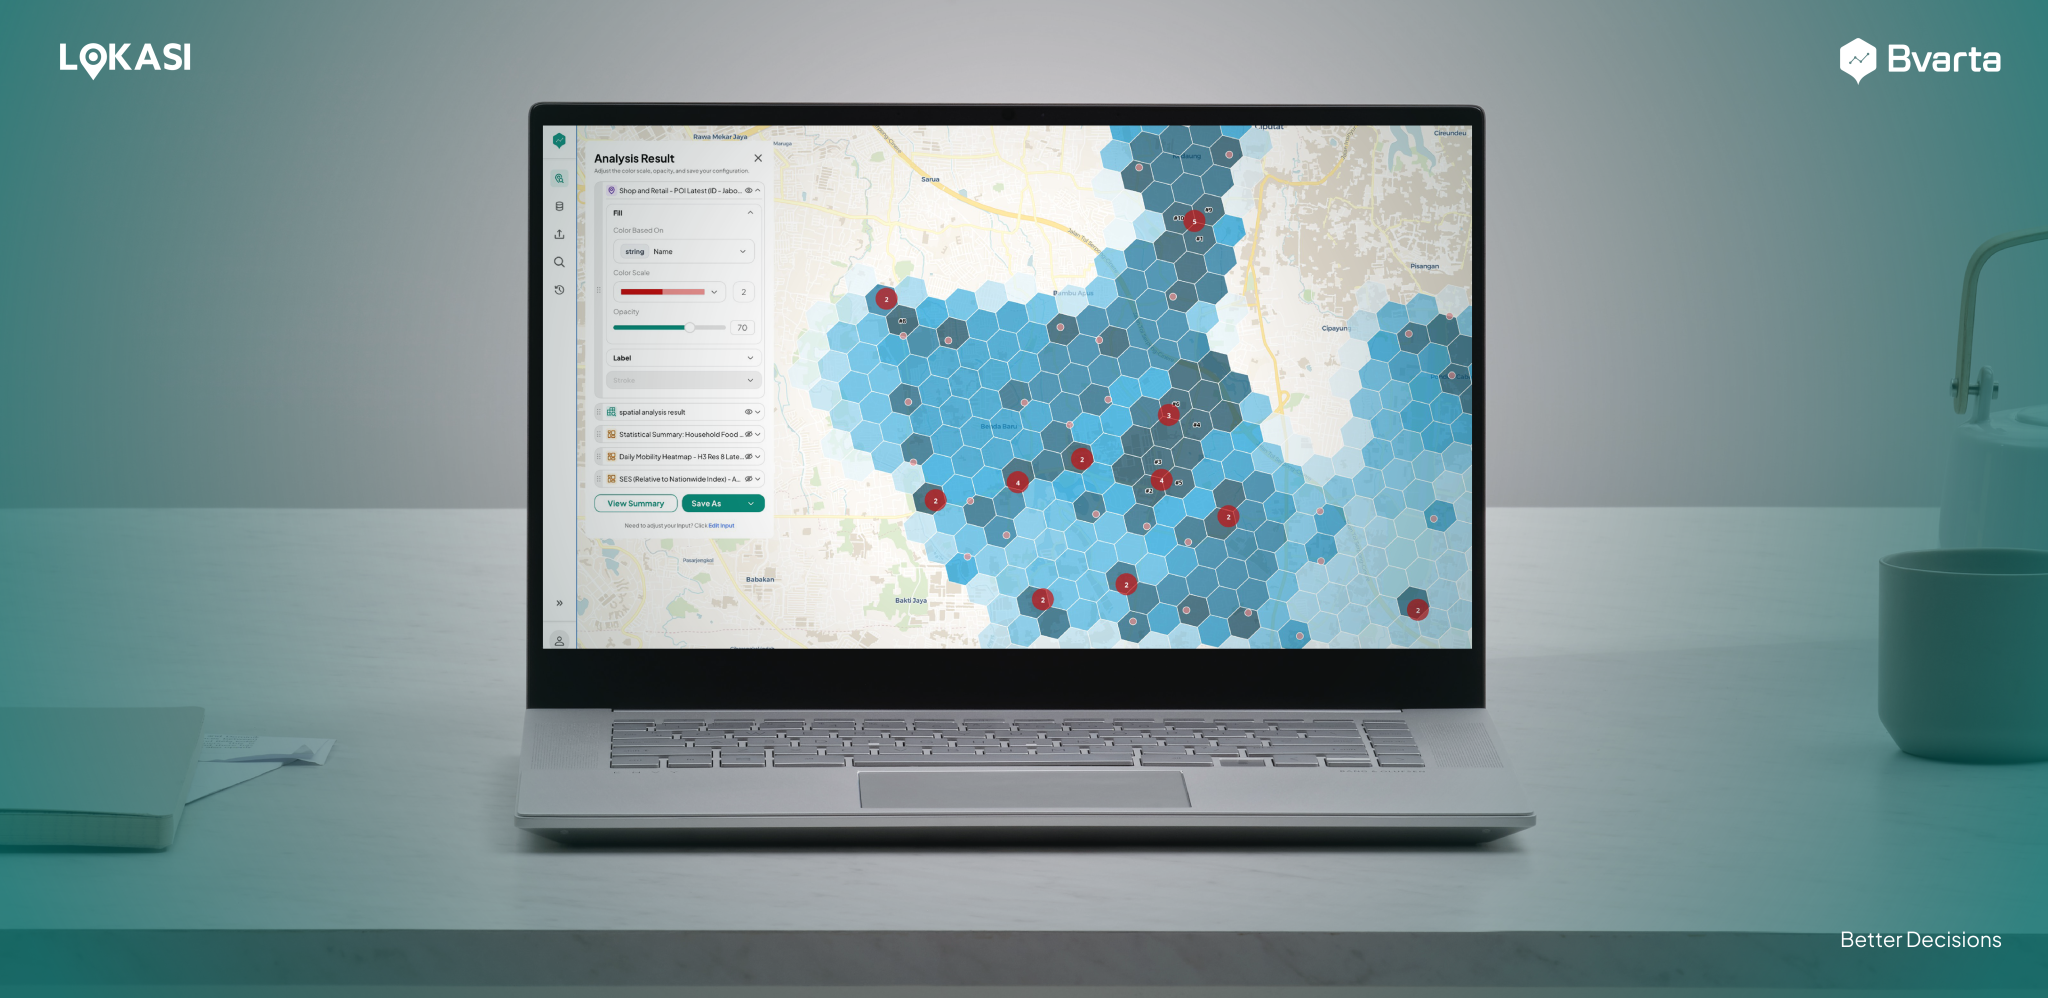
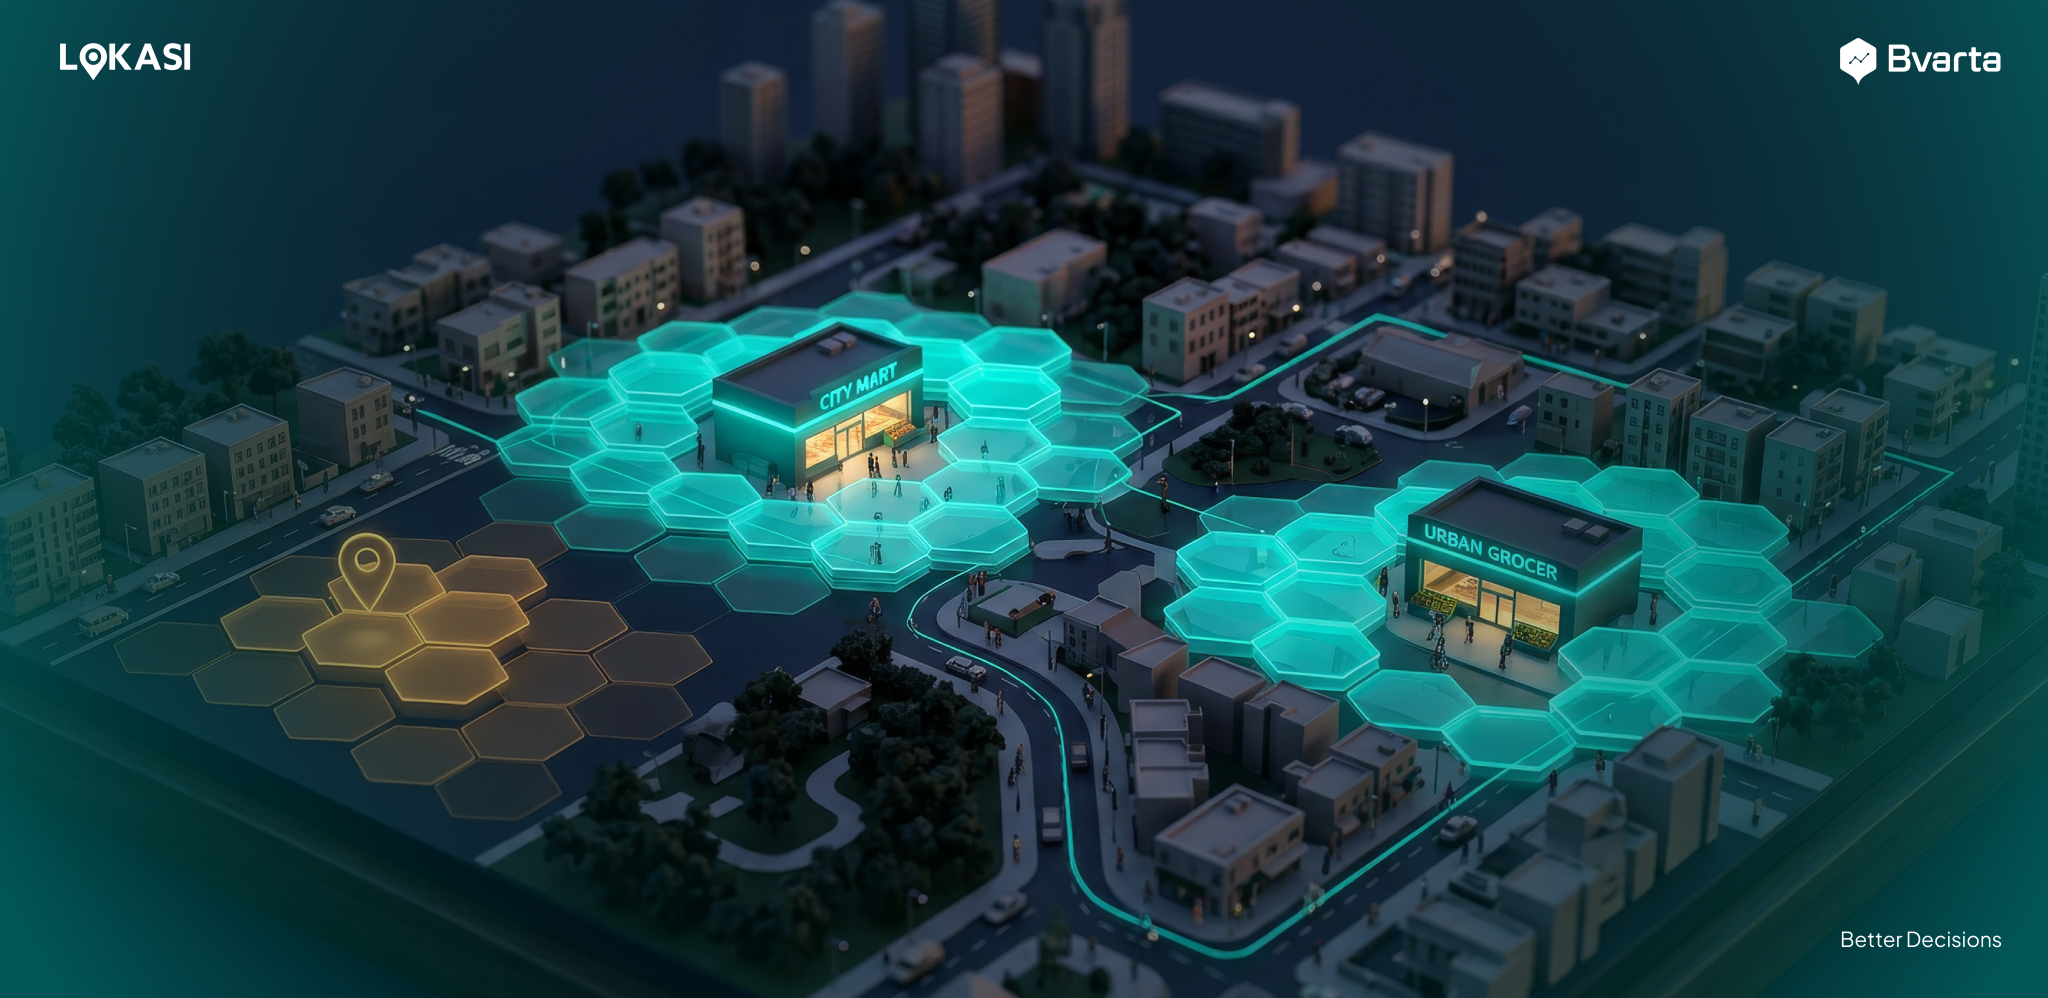
These layers are combined into a hexagonal grid covering the analyzed area, where darker cells represent the strongest primary trade zones , while lighter cells at the edges show where the catchment weakens. The result is a heat map of a location’s real drawing power, cell by cell, rather than a single radius number that treats every point inside it as equally valuable.
Define Your True Catchment Area With LOKASI
LOKASI Intelligence builds catchment areas from actual road networks rather than simplified radii, then layers SES, mobility, and competitor data on top to produce a hexagonal trade area map. This shows not just where the catchment ends, but which parts of it actually matter most.
Get a more accurate read on your store’s real trade area. Reach out for a free consultation via WhatsApp at 0877 7907 7750 or through bvarta.com/contact-us.
FAQ
What is a catchment area in retail?
A catchment area is the geographic zone from which a store realistically draws most of its customers, typically defined by actual travel time along the road network rather than a simple radius.
Why is a simple radius not accurate enough?
Road networks are rarely symmetrical, so a radius can overstate demand in directions with poor access and understate it in directions with strong access, leading to inaccurate revenue projections.
How does LOKASI define a catchment area differently?
LOKASI builds catchment areas as isochrones based on real driving or walking time, then layers SES, mobility, and competitor data into a hexagonal grid that shows which parts of the catchment are the strongest trade zones.
References
PassBy. (2026). Site selection criteria: The 10 factors that determine whether a retail location will work. https://passby.com/blog/site-selection-criteria/