
FMCG margins are thin by design. A few percentage points of inefficiency in distribution can erase the profit on an entire product line, long before a single marketing decision comes into play.
Most of that inefficiency does not come from the product itself. It comes from where goods are stored and how far they have to travel before reaching a shelf or a doorstep. Distribution is a location problem as much as it is a logistics problem.
This article looks at how location intelligence helps FMCG companies plan distribution more precisely, from warehouse placement to delivery radius.
Contents
- 1 The Distribution Challenge for FMCG
- 2 What Inefficient Distribution Actually Costs
- 3 Where Location Intelligence Fits In
- 4 A Simple Illustration
- 5 Key Data Points to Use
- 6 Why Traditional Retail Still Drives the Map
- 7 What Adopting This Approach Actually Requires
- 8 Why This Matters More Now
- 9 Plan Smarter Distribution with LOKASI
- 10 FAQ
- 11 References
The Distribution Challenge for FMCG
FMCG distribution deals with high volume, low margin, and a wide spread of SKUs that all need to move fast. Unlike e-commerce parcels, FMCG goods are usually moving toward thousands of small retail points rather than individual doorsteps, which makes route density and warehouse placement disproportionately important.
The cost concentration in this kind of network tends to sit in the final leg of delivery. Industry research consistently shows that last-mile delivery can account for roughly 40 to 50 percent of total logistics costs, even though it covers the shortest distance in the entire supply chain [1]. For FMCG companies running dense distribution networks, that final leg is usually where the biggest savings are still sitting untapped.
What Inefficient Distribution Actually Costs
A few percentage points on a thin-margin product line sounds abstract until it is put in terms an operations budget actually tracks. If last-mile delivery represents 40 to 50 percent of total logistics spend, then even a modest improvement compounds quickly:
- A 10 percent reduction in average delivery distance per route does not just save fuel. It reduces the number of vehicle trips needed to cover the same territory, which lowers fleet, driver, and maintenance costs together. The scale of this effect is well documented: UPS’s ORION route-optimization system now saves the company roughly 100 million miles and 10 million gallons of fuel annually, translating into an estimated $300–400 million in yearly cost avoidance [3].
- Poorly placed depots do not fail obviously. They fail quietly, in the form of routes that run longer than they need to, delivery windows that slip during peak traffic, and sales reps who spend more time traveling between outlets than selling into them.
- Because FMCG networks are high-frequency by nature, small inefficiencies repeat daily across thousands of stops. A route that is 15 percent longer than necessary is not a one-time cost. It is a cost paid every single delivery day, indefinitely, until the network is re-planned.
This is why distribution planning deserves the same rigor as pricing or trade spend. It is a recurring cost, not a one-time decision.
Where Location Intelligence Fits In
Location intelligence turns distribution planning from a manual, experience-based exercise into a data-driven one. Instead of placing a warehouse based on available land or historical habit, planners can evaluate candidate sites against the actual distribution of demand.
This matters for a few core decisions:
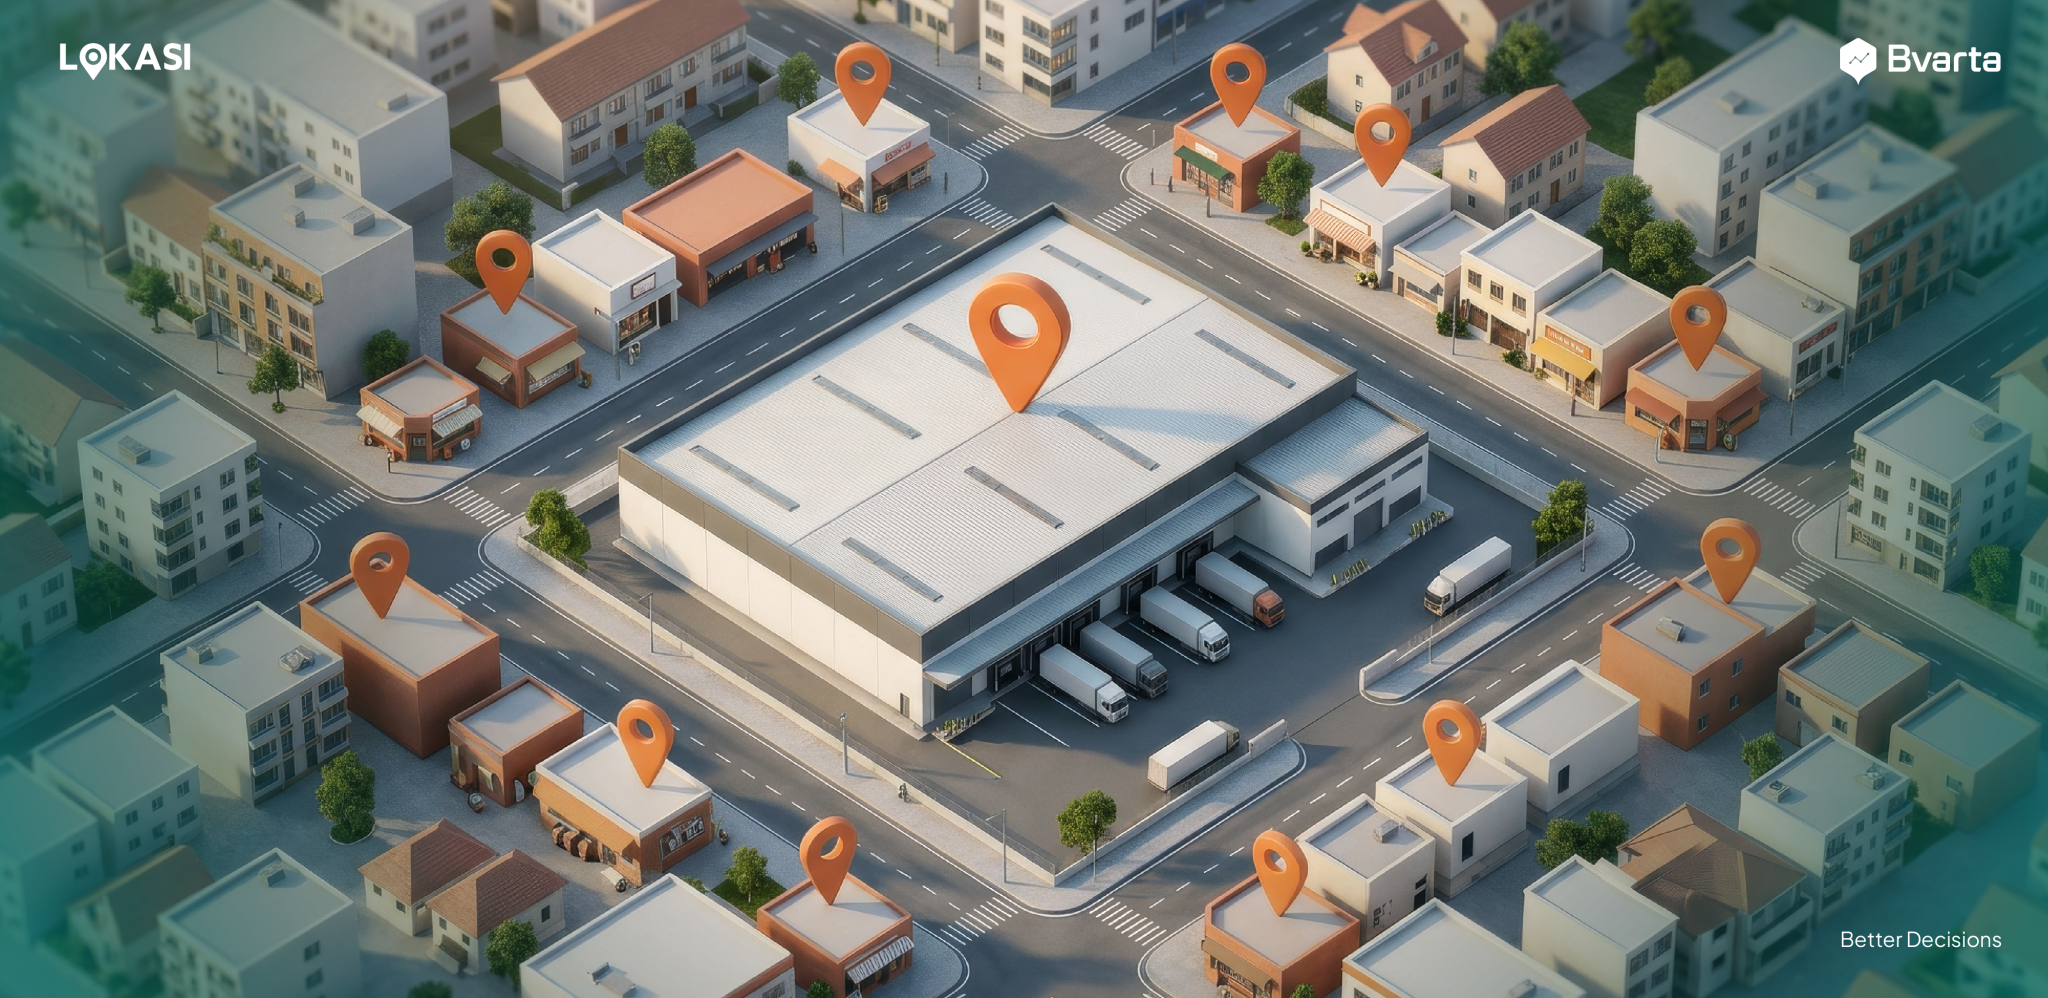
- Warehouse and depot placement: choosing a location that minimizes average travel distance to the highest concentration of retail outlets in a territory, rather than simply the cheapest available land.
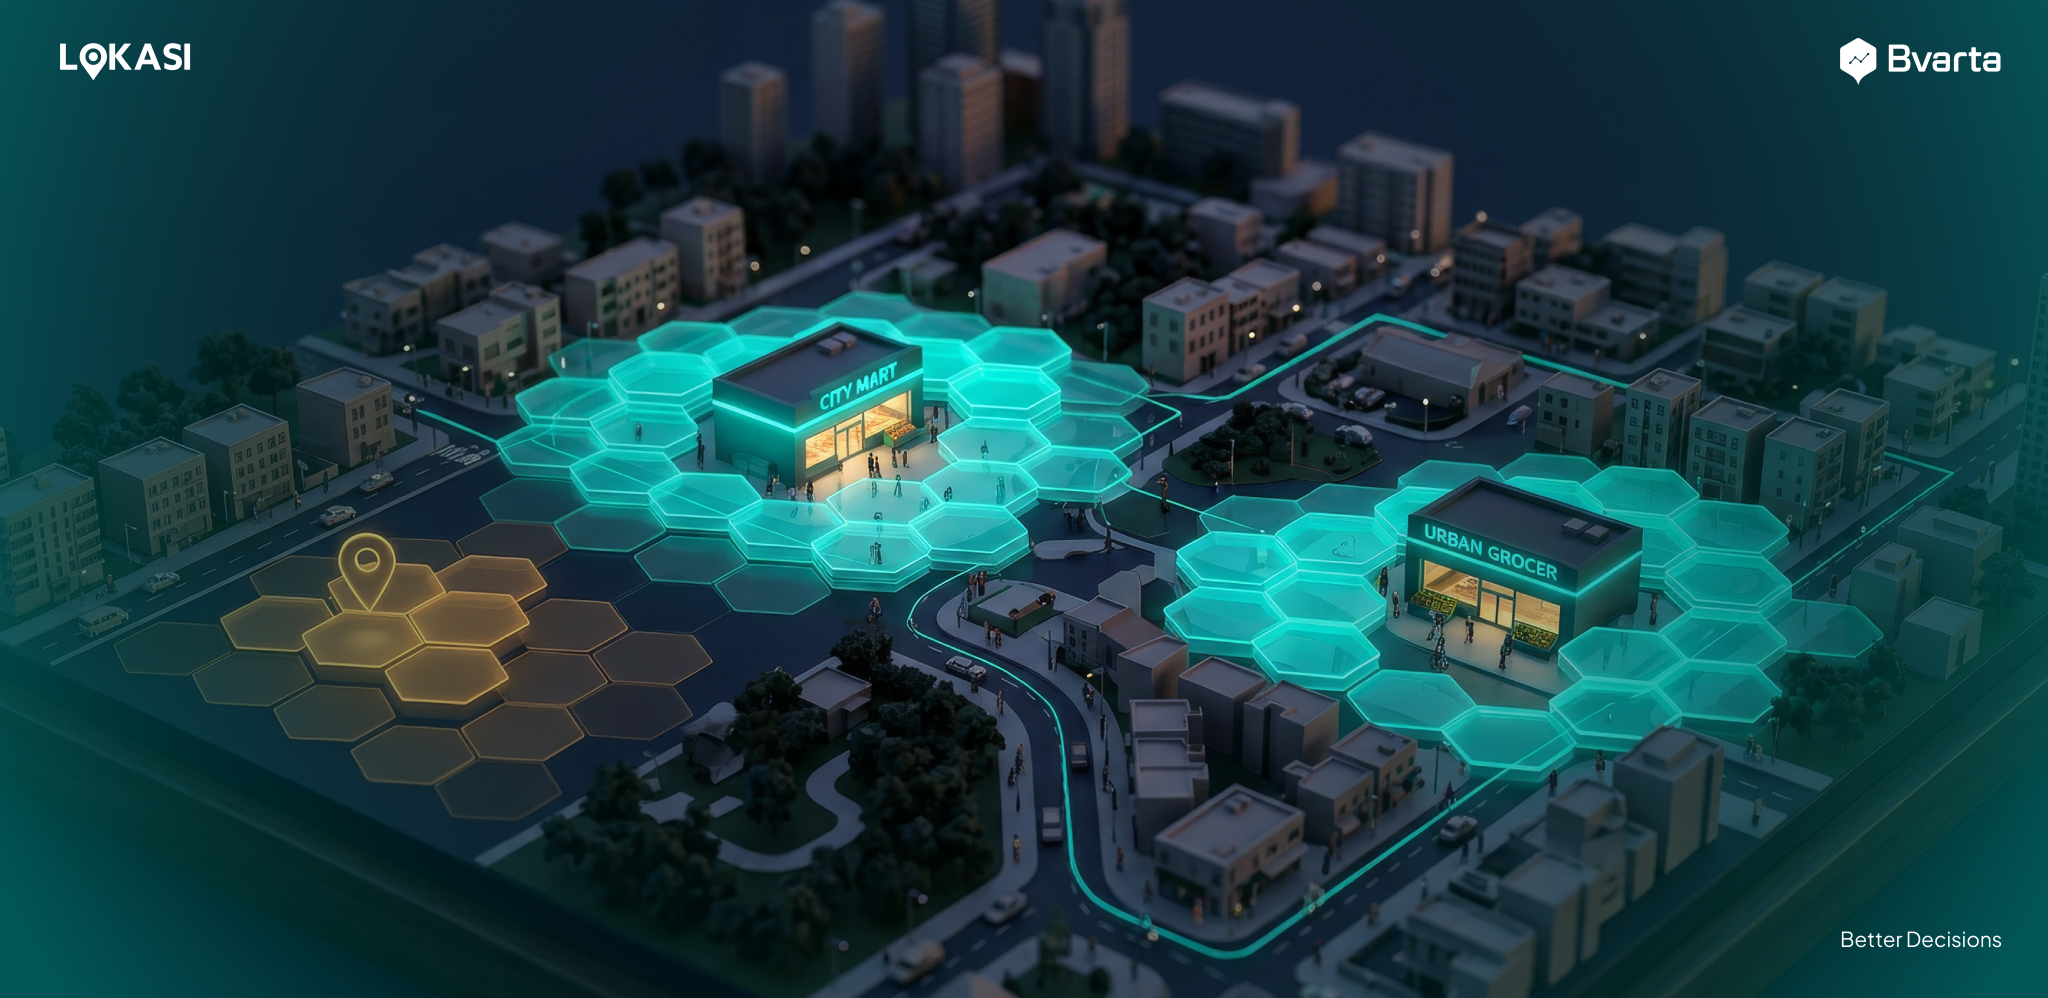
- Delivery radius planning: defining a realistic delivery radius based on actual road networks and travel time, not a simple circle on a map.
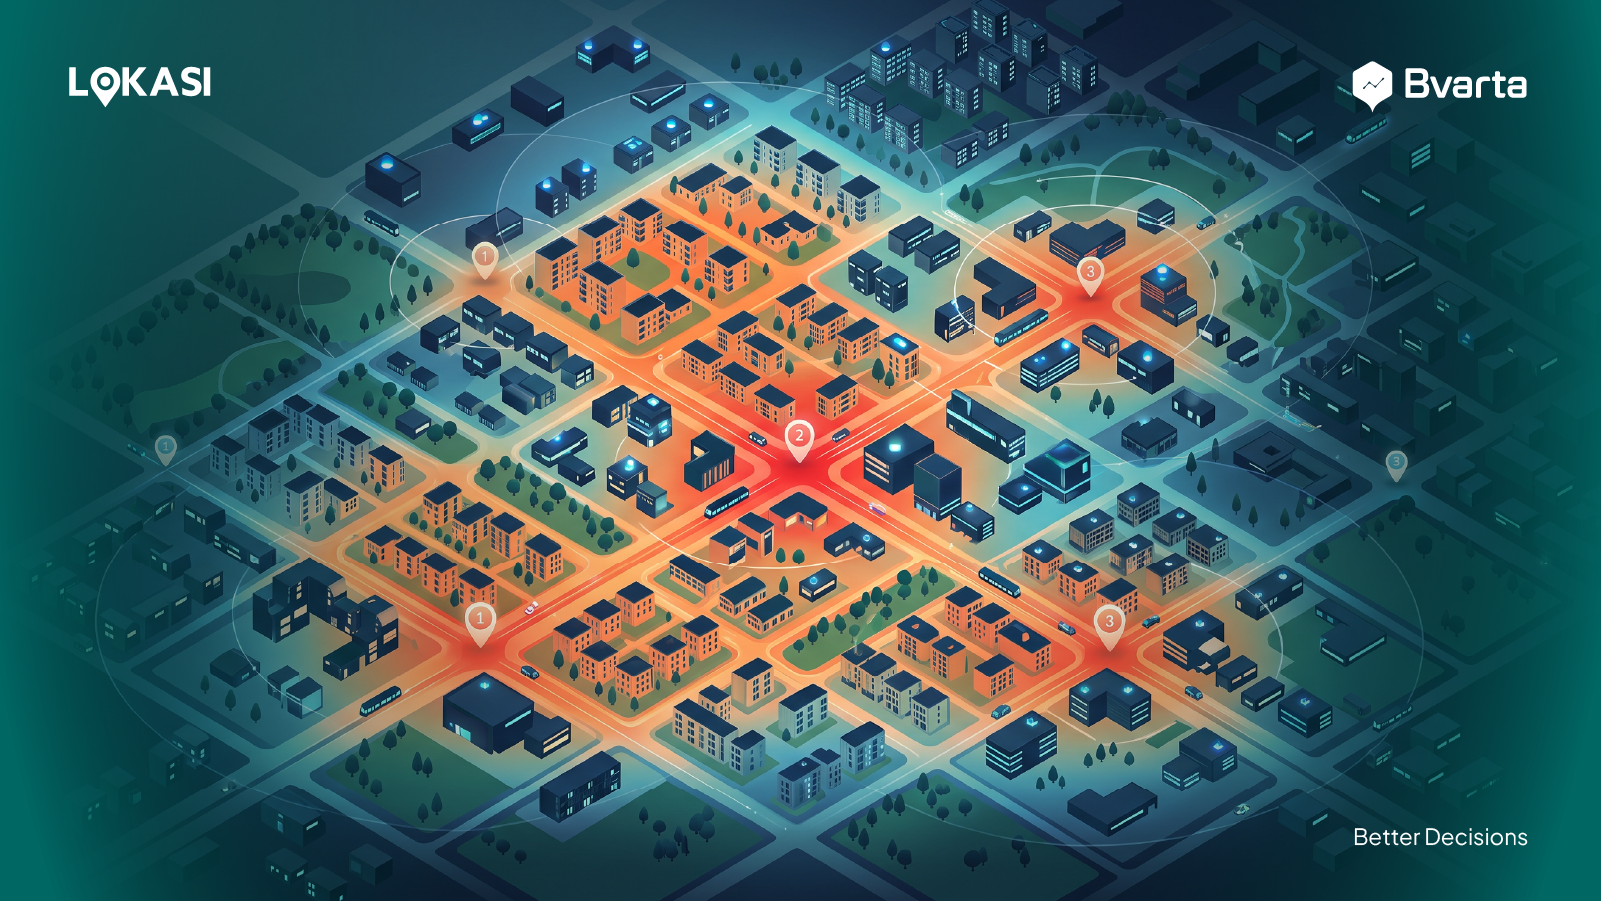
- Territory division: splitting sales and delivery territories so they reflect real outlet density, rather than splitting administrative boundaries that may not match where the demand sits.
A Simple Illustration
Consider a distributor covering a metro area from a single, centrally-located warehouse chosen years ago because the land was available and affordable. Over time, retail outlet growth in the territory shifts outward, toward newer residential and commercial clusters the warehouse was never sited for.
Without a way to see that shift, the warehouse location looks unchanged and un-problematic on paper. In practice, an increasing share of outlets are now outside the original efficient delivery radius, and routes have quietly lengthened without anyone deciding that they should.
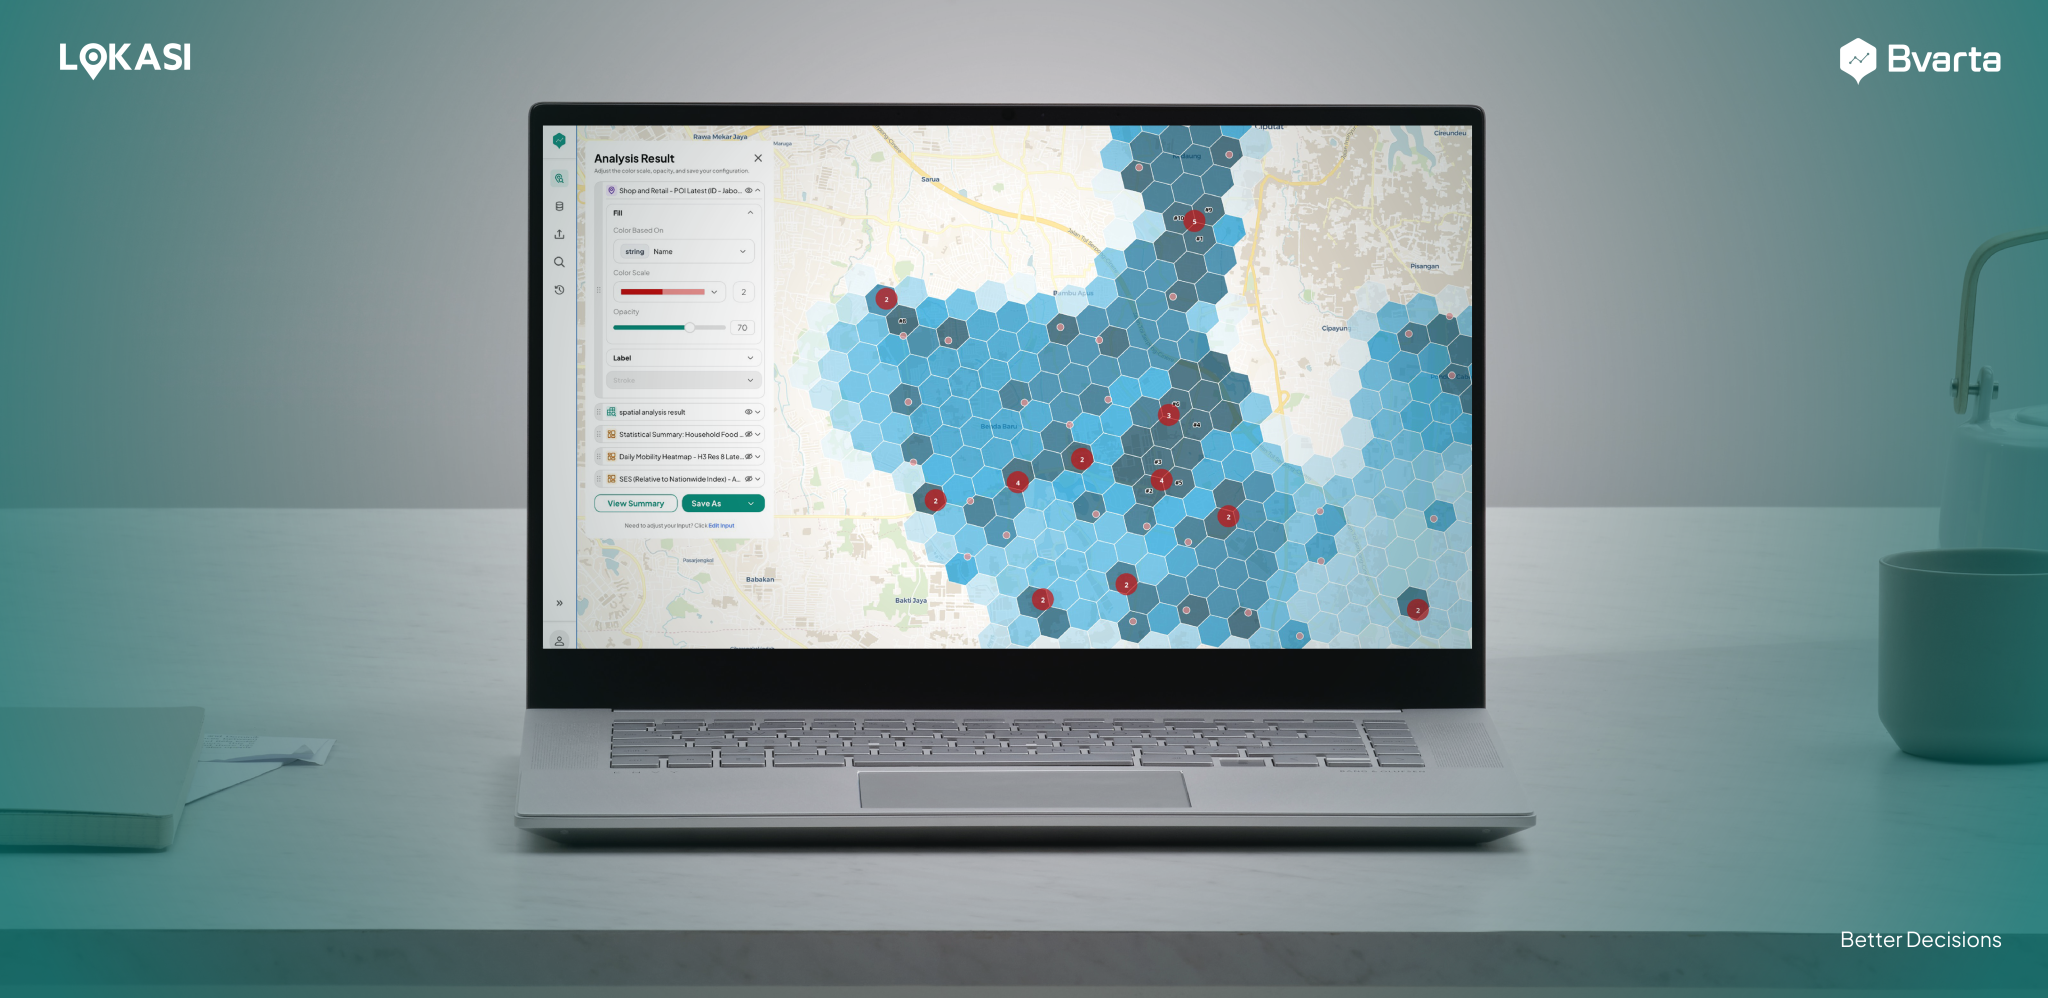
Mapping actual outlet density against the current warehouse location makes this visible immediately, something a spreadsheet of delivery addresses rarely surfaces on its own. The fix is not always a new warehouse. Sometimes it is a second smaller depot, a redrawn territory boundary, or a change in which outlets are served on which day. The point is that the decision becomes visible and data-backed, rather than something nobody notices until costs have already crept up
Key Data Points to Use
A distribution-focused location analysis typically draws on:
- Population and outlet density: how many people and retail outlets exist within a given radius of a candidate site.
- Road network and accessibility: the routes actually available for trucks and motorcycles, since a straight-line radius rarely reflects real travel time.
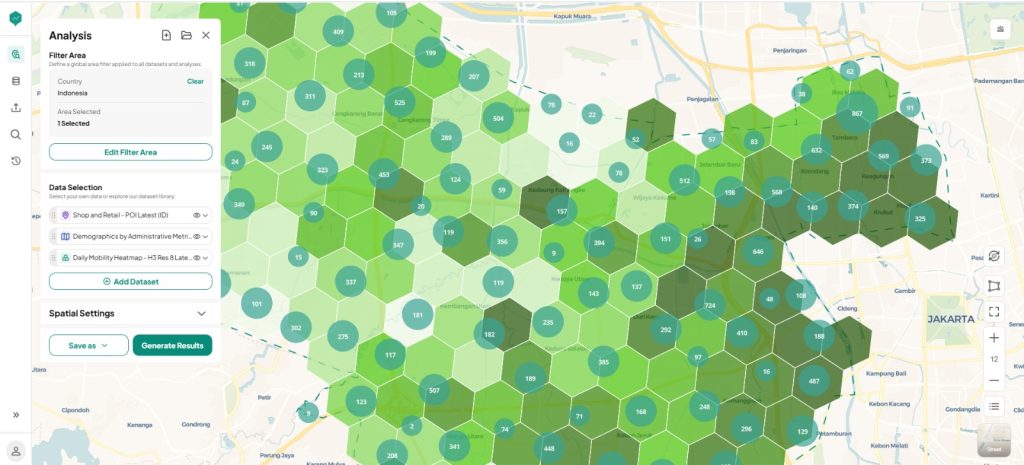
- Retail outlet distribution: where minimarkets, traditional trade , and modern retail outlets are concentrated, since this defines where products ultimately need to land.
- Mobility patterns: how people and goods move through an area at different times of day, which affects optimal delivery windows.
Why Traditional Retail Still Drives the Map
In most emerging and developing FMCG markets, general trade (small independent stores, wet markets, and informal outlets) still accounts for a large share of sell-through, even as modern trade and e-commerce grow quickly in urban centers. In Asia specifically, traditional trade continues to lead FMCG sales, generated by millions of small stores across the region, and still accounts for the majority of rural FMCG sales in several major markets [2]. This has a direct planning implication: a distribution model built only around modern trade chains or major cities misses where most of the volume actually moves.
The specifics vary by market and are worth mapping deliberately rather than assumed:
- Channel mix shifts by region and even by neighborhood: general trade density near a candidate warehouse site can look very different from the national average.
- Road and terrain conditions are rarely uniform across a country. Dense urban grids, informal settlements, rural roads, and seasonal disruptions (monsoon flooding, for example) all affect what a “realistic” delivery radius actually means in a given area.
- Delivery mode often needs to vary with density. Motorcycles or smaller vehicles may serve dense, informal urban areas more efficiently than trucks, which changes how route density should be calculated.
- Seasonal demand swings, tied to local holidays or shopping calendars, can temporarily shift which channel and which outlets matter most.
A location intelligence approach that incorporates local outlet, mobility, and road data captures these dynamics directly, rather than approximating them with a generic template.
What Adopting This Approach Actually Requires
Location intelligence is not a plug-in fix, and it is worth being direct about what it takes to get value from it:
- Data integration. Outlet lists, sales territory boundaries, and delivery records need to be brought into a common view alongside population and mobility data. This is usually the longest step, though it is a one-time setup rather than an ongoing burden.
- Sales and ops alignment. Territory changes affect how sales teams are structured and compensated. Any re-planning exercise needs buy-in from the people who currently own those territories, not just the analytics team recommending the change.
- A defined pilot scope. The companies that get the most out of this start with one region or one warehouse decision, prove the model, then expand, rather than trying to re-plan an entire network at once.
None of this changes the underlying case. It simply means the first step is usually a focused diagnostic on a specific territory or warehouse decision, not a full network overhaul.
Why This Matters More Now
Delivery expectations across FMCG retail are tightening, driven in part by quick-commerce players compressing what “fast” means for both consumers and retail partners. Distribution networks built five or ten years ago, when a warehouse location decision could last a decade without review, are increasingly being tested by outlet growth patterns, urban expansion, and delivery speed expectations that did not exist when those decisions were made.
Companies that treat distribution planning as a static, one-time decision are increasingly the ones absorbing avoidable cost. Companies that revisit it as demand shifts are the ones capturing the savings sitting inside the last mile.
Plan Smarter Distribution with LOKASI
LOKASI Intelligence brings together population, retail outlet, and mobility data to support distribution planning that is grounded in where demand actually sits, not just where land is available or cheap.
Start with a focused diagnostic: bring your current warehouse or depot locations, and we’ll map them against real outlet density and mobility data for your territory to show where the gaps are. Reach out for a free consultation via WhatsApp at 0877 7907 7750 or through bvarta.com/contact-us.
FAQ
How does location intelligence help FMCG distribution planning?
It replaces assumptions about warehouse and territory placement with data on population density, outlet distribution, road networks, and mobility patterns, helping companies place infrastructure where demand actually concentrates.
What data is most useful for choosing a warehouse location?
Population and retail outlet density, real road network accessibility, and mobility patterns are the core inputs, since they reflect where demand sits and how realistically it can be reached.
Can location intelligence reduce last-mile delivery costs?
Yes. Since last-mile delivery often makes up 40 to 50 percent of total logistics costs, even small improvements in warehouse placement and territory design can meaningfully reduce overall distribution expenses.
References
[1] Express Carriers Association. (2026). The true costs of final-mile delivery, and how shippers and carriers can reduce them. https://ecadeliveryindustry.org/the-true-costs-of-final-mile-delivery-and-how-shippers-and-carriers-can-reduce-them/ — citing analysis from ASCM (Association for Supply Chain Management): https://www.ascm.org/topics/last-mile-delivery/
[2] NielsenIQ. (2022). Mapping the shift in FMCG retail channel trends. https://nielseniq.com/global/en/insights/analysis/2022/mapping-the-shift-in-fmcg-retail-channel-trends/
[3] Holland, C., Levis, J., Nuggehalli, R., Santilli, B., & Winters, J. (2017). UPS Optimizes Delivery Routes. Interfaces, 47(1), pages 8 to 23. https://doi.org/10.1287/inte.2016.0875. This is a peer-reviewed case study co-authored by UPS’s own operations research team, and winner of the 2016 Franz Edelman Award for Achievement in Operations Research and the Management Sciences.