
Why Expanding in a Planned Township Is Harder Than It Looks
Conventional site selection often relies on gut feeling, broker recommendations, or simply following where competitors already operate. In a complex urban structure like BSD City, that approach fails in two directions at once. You either open in a corridor that is already saturated, or you overlook a white space zone where a captive market is waiting. The stakes are real. Research on retail site selection has long shown that location and competition are the decisive success factors for a new store, and that a poor location decision carries serious financial and brand risks (Roig-Tierno et al., 2013). A study of convenience stores in Seoul reached a similar conclusion from the demand side: stores cluster where consumer purchasing capacity concentrates, which means the winners are the ones who read that concentration correctly (Seong et al., 2022). So instead of asking “where is land available,” the BSD City study asked a better question: where does retail demand actually live, and how much of it can a new store capture?Step One: Map Demand Before You Pick a Site
The study’s first move was building a demand surface map using Kernel Density Estimation (KDE). In plain terms, KDE converts scattered data points, such as population counts and points of interest, into a continuous heat map of retail demand. The bandwidth was set at 800 meters, roughly a 10 minute walk in a planned residential area. Four weighted factors shaped the map: Table 1. Weighted demand factors used to build the KDE demand surface for BSD City (Jazma, 2026).| Demand factor | Weight | Why it matters |
| Population density per neighborhood | 40% | Concentration of potential shoppers around a candidate site |
| Trip generator density within 500 m | 30% | Schools, offices, hospitals, and malls that pull daily foot traffic |
| Road and transit accessibility | 20% | Distance to arterial roads, collector roads, commuter rail stations, and toll access |
| Commercial zoning suitability | 10% | Alignment with the official spatial plan for trade and services |
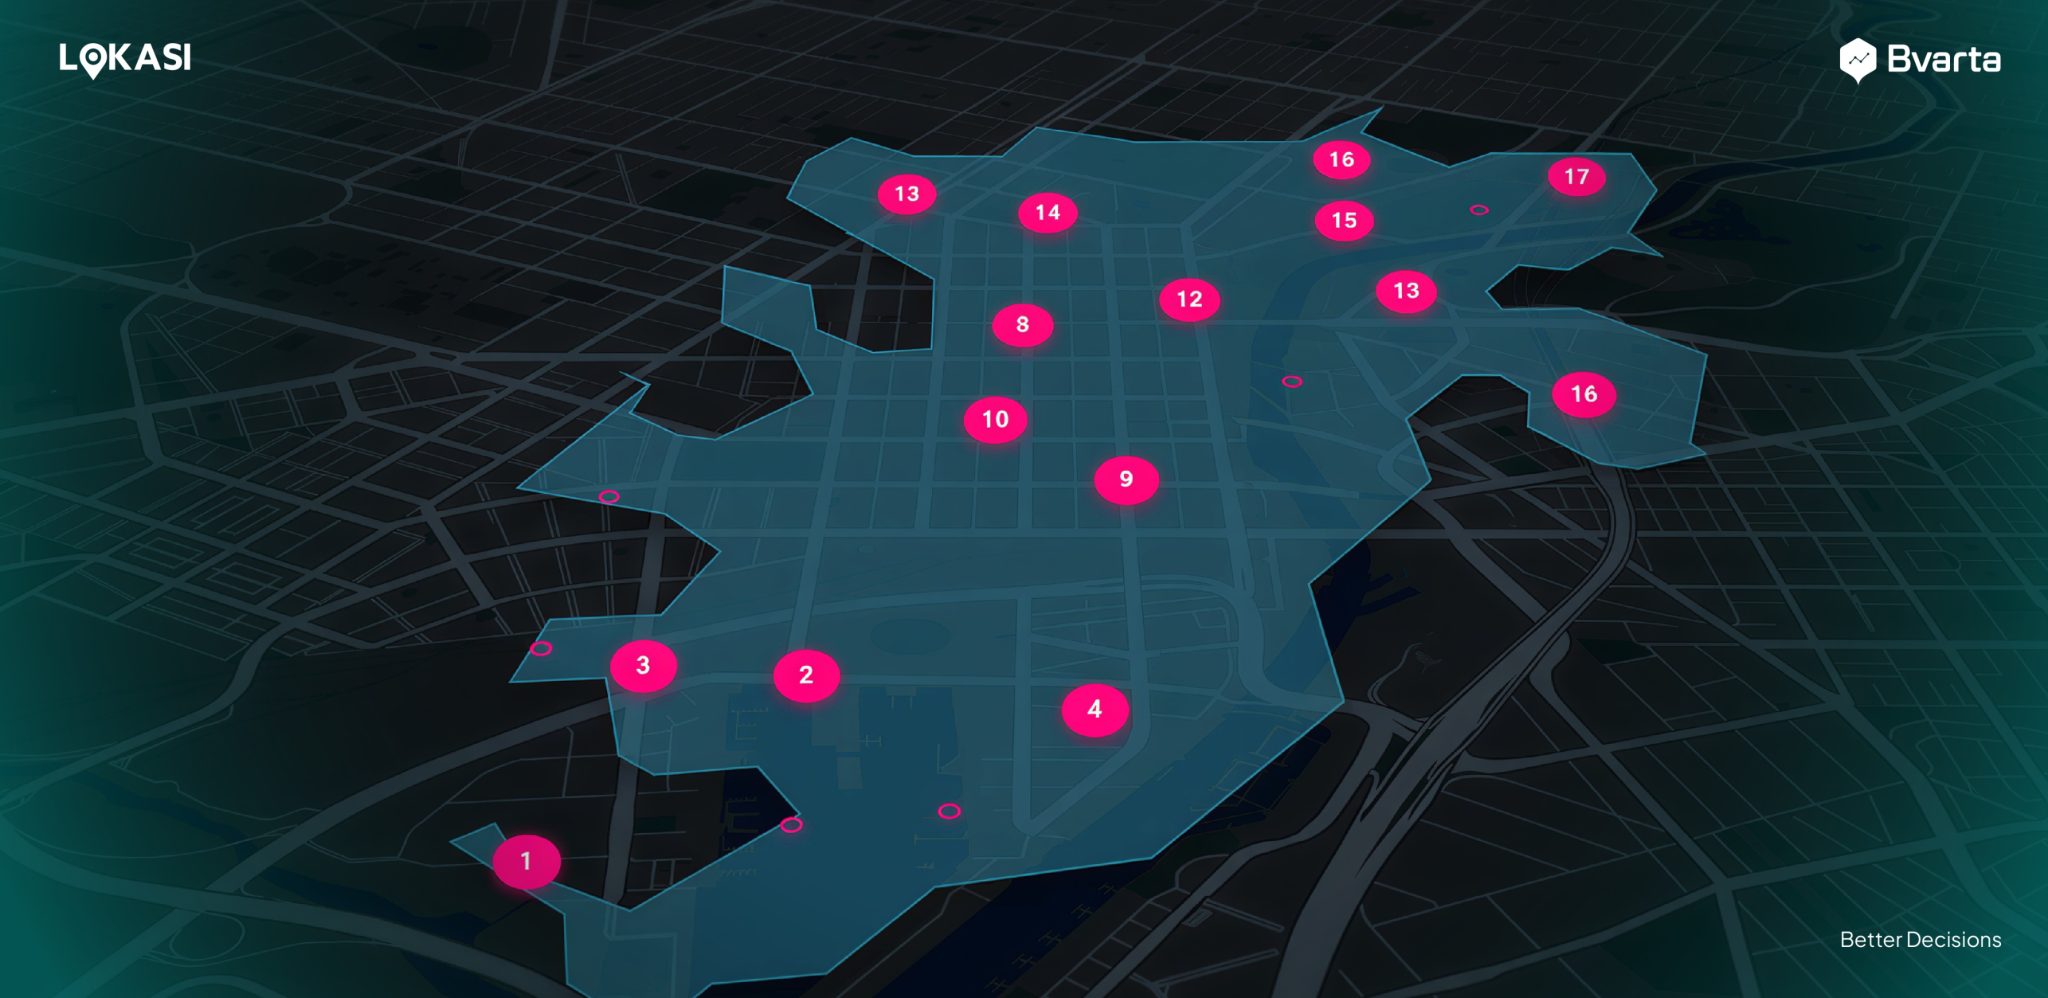
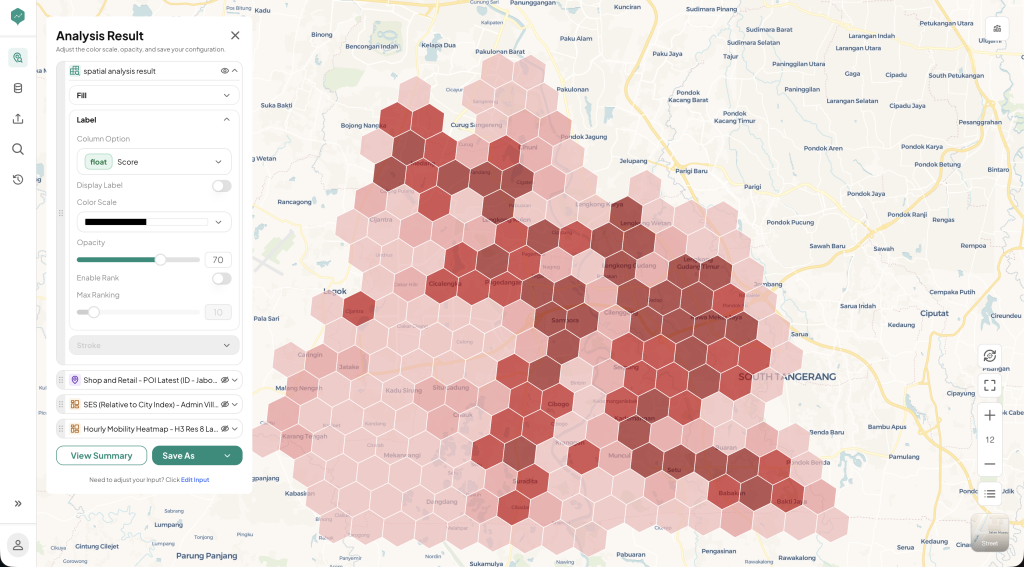 Figure 1. A demand surface map classifies an area into demand tiers, revealing underserved zones before any site visit.
Darker colors mark zones where population density, trip generators, and road accessibility overlap most strongly, while cooler colors mark thinner demand. A promising gap zone is easy to spot. It glows warm on the map but has few existing store markers around it.
Figure 1. A demand surface map classifies an area into demand tiers, revealing underserved zones before any site visit.
Darker colors mark zones where population density, trip generators, and road accessibility overlap most strongly, while cooler colors mark thinner demand. A promising gap zone is easy to spot. It glows warm on the map but has few existing store markers around it.
Step Two: Estimate How Much Market a New Store Can Capture
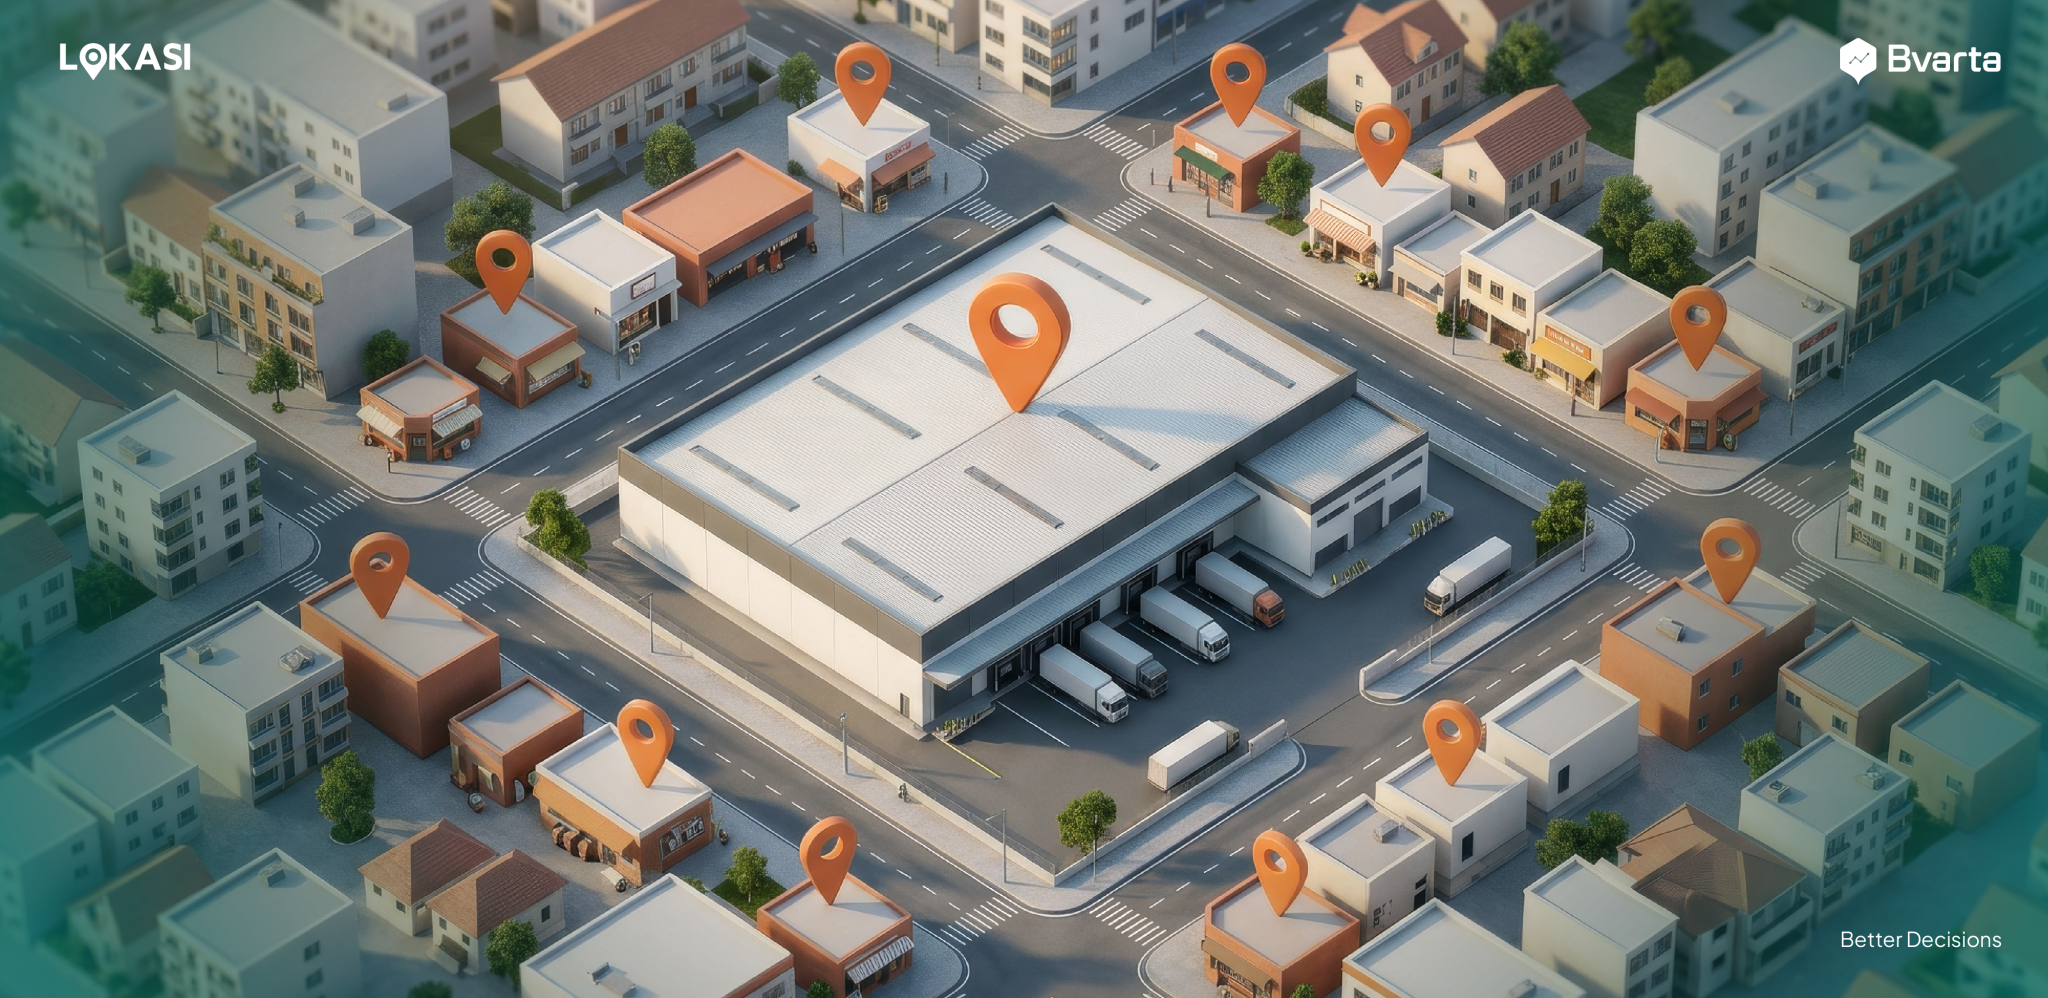
A high demand score alone does not guarantee sales. Consumers choose between stores, and distance shapes that choice. To account for this, the study applied the Huff Model, a gravity based model that estimates the probability of a shopper from a given zone visiting a particular store, based on the store’s attractiveness and travel distance. Running the model across 20 candidate sites produced some striking numbers. The top five candidates showed visit probabilities above 40 percent of the population within a 1.5 kilometer radius. Three white space zones stood out, each with high demand but no modern retail within 600 meters:- Cisauk to Pagedangan corridor: new residential clusters with fast household growth and minimal store coverage.
- Digital Hub BSD surroundings: a dense mix of offices and universities generating weekday traffic all day long.
- Serpong Utara to Pakulonan border: established, dense housing with retail supply that never caught up.
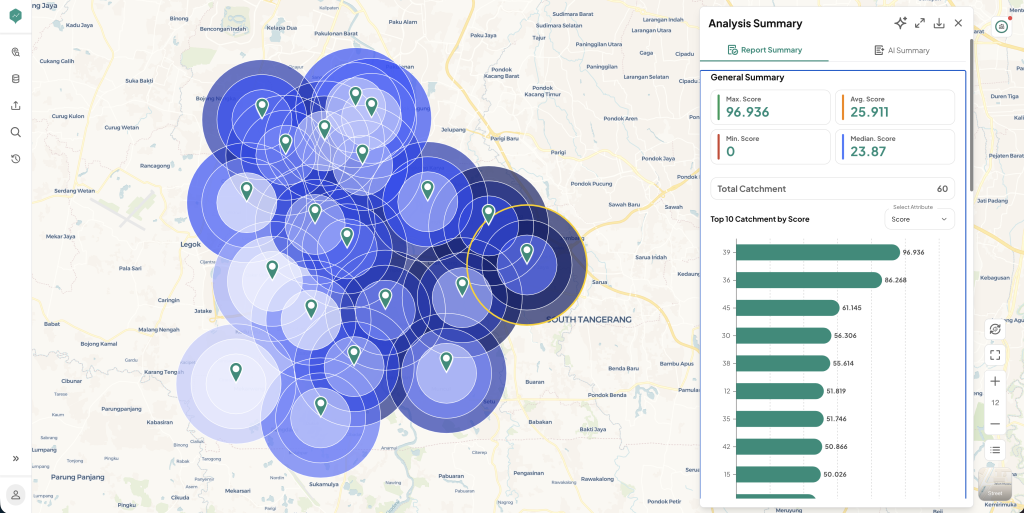 Figure 2. Trade area delineation with drive time isochrones shows exactly which households a candidate site can realistically serve.
Each ring is a drive time isochrone around the candidate site. The innermost ring covers everything reachable within 5 minutes, which forms the primary trade area where most daily shoppers live. The 10 and 15 minute rings capture secondary demand that visits less often, so household counts inside each ring translate directly into sales potential.
Figure 2. Trade area delineation with drive time isochrones shows exactly which households a candidate site can realistically serve.
Each ring is a drive time isochrone around the candidate site. The innermost ring covers everything reachable within 5 minutes, which forms the primary trade area where most daily shoppers live. The 10 and 15 minute rings capture secondary demand that visits less often, so household counts inside each ring translate directly into sales potential.
Step Three: What Actually Drives Store Performance
The most practical part of the study came from its Variable of Importance analysis. By regressing the performance of 39 existing minimarkets in South Tangerang against measurable spatial variables, the study quantified which location factors matter most. Three variables explained the bulk of the variation in daily sales:- Distance to the nearest housing cluster (42 percent): stores located within 250 meters of an active residential cluster recorded average daily sales 2.6 times higher than stores more than 700 meters away, based on the study’s regression of actual sales data from its 39 store sample (Jazma, 2026).
- Variety of trip generators within 500 meters (33 percent): each additional type of trip generator, such as a school, office, or clinic, correlated with a 12 to 18 percent increase in customer traffic.
- Collector road density within 300 meters (16 percent): direct access from collector roads drove spontaneous, impulse visits from passing drivers.
Step Four: Rank Priority Sites and Prepare the Rollout Plan
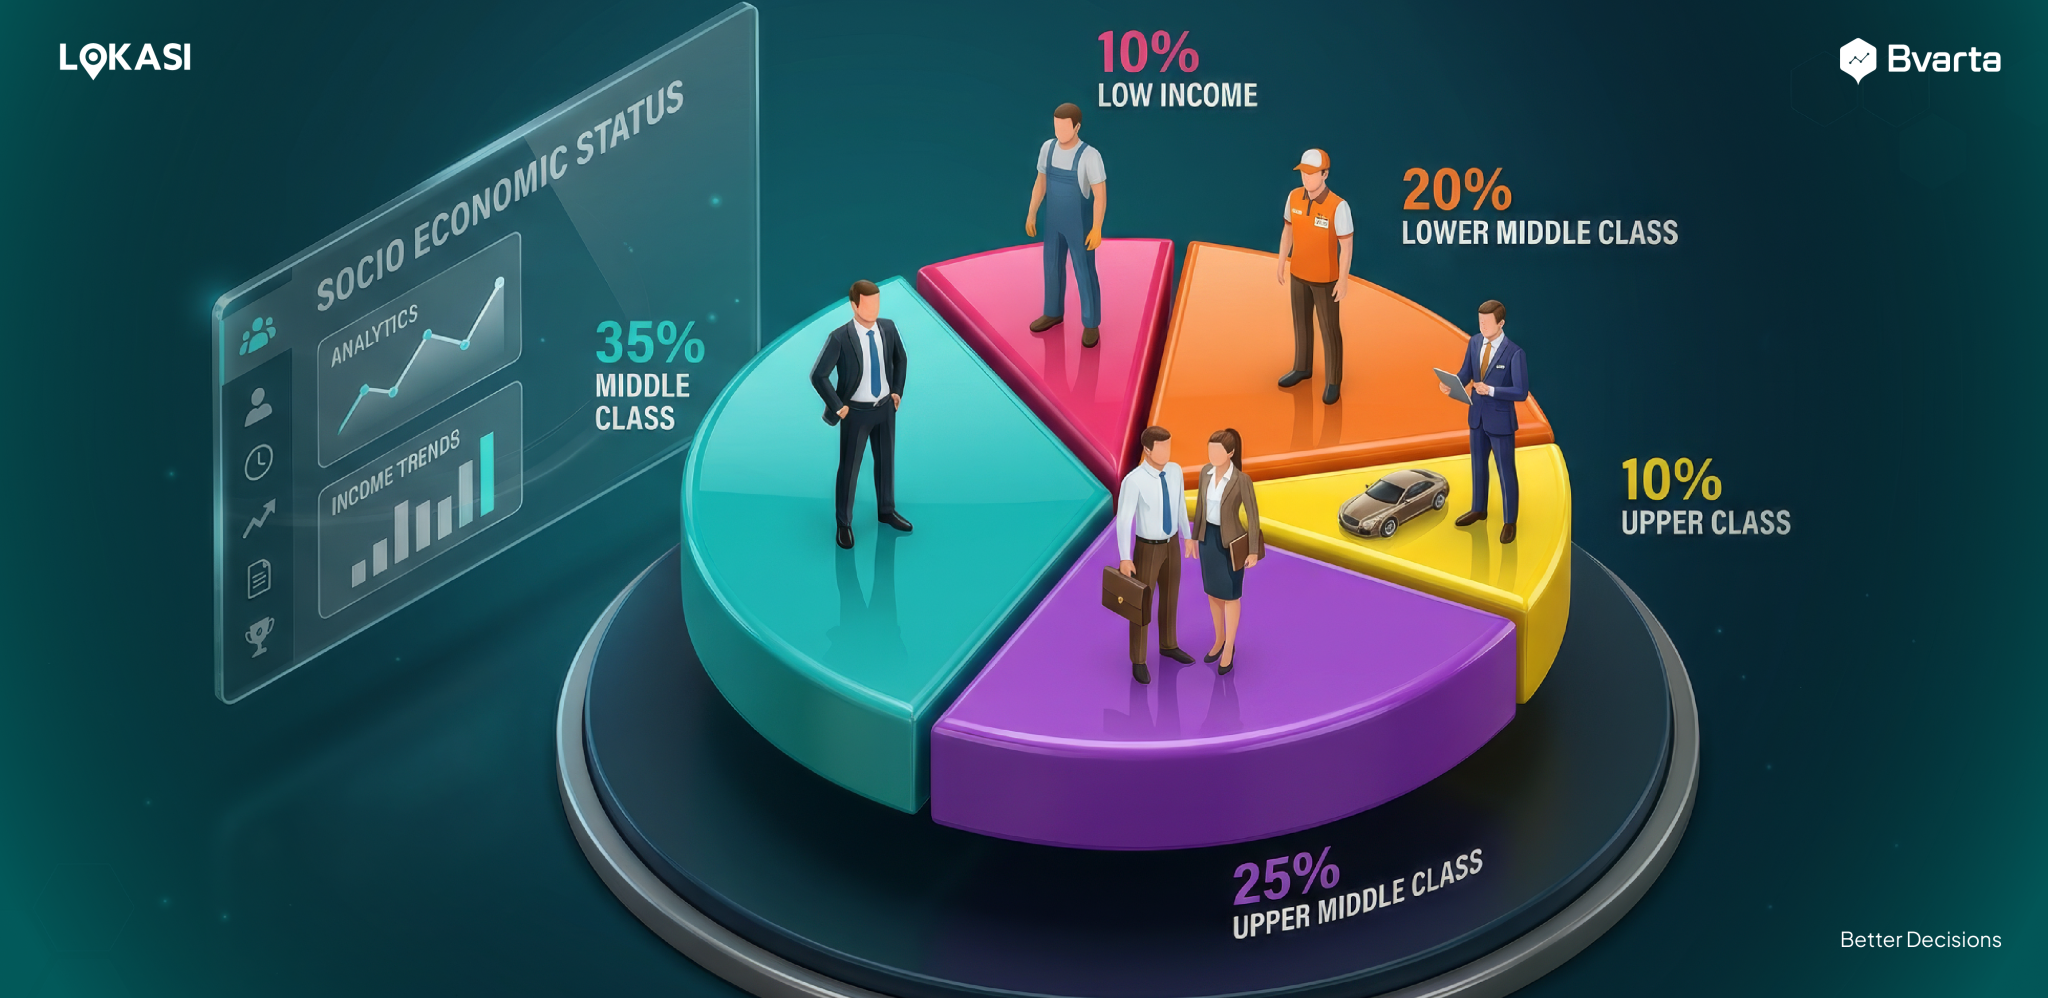
Demand, capture, and performance drivers each answer a different question. Combined into a single Site Scoring Index, they answer the one that matters to a real estate committee: which sites go first. Weighting the three Variable of Importance factors, the study ranked all 20 candidates and narrowed them to a 15 site priority list, then built a detailed profile for the top 10. The profile of those top 10 sites reads like a target customer brief:- Consumer profile: urban professionals aged 25 to 45 with upper middle income and convenience driven shopping habits, the dominant resident type across BSD City.
- Household reach: each primary trade area, the 5 minute drive zone, covers 4,500 to 9,000 households on average.
- Open competitive runway: 6 of the 10 top sites have no national minimarket chain within 500 meters, leaving room for a first mover advantage.
- Built in accessibility: 8 of the 10 top sites sit within 300 meters of a collector road, which the Variable of Importance analysis already flagged as a key driver of impulse visits.
From Research Method to Business Decision
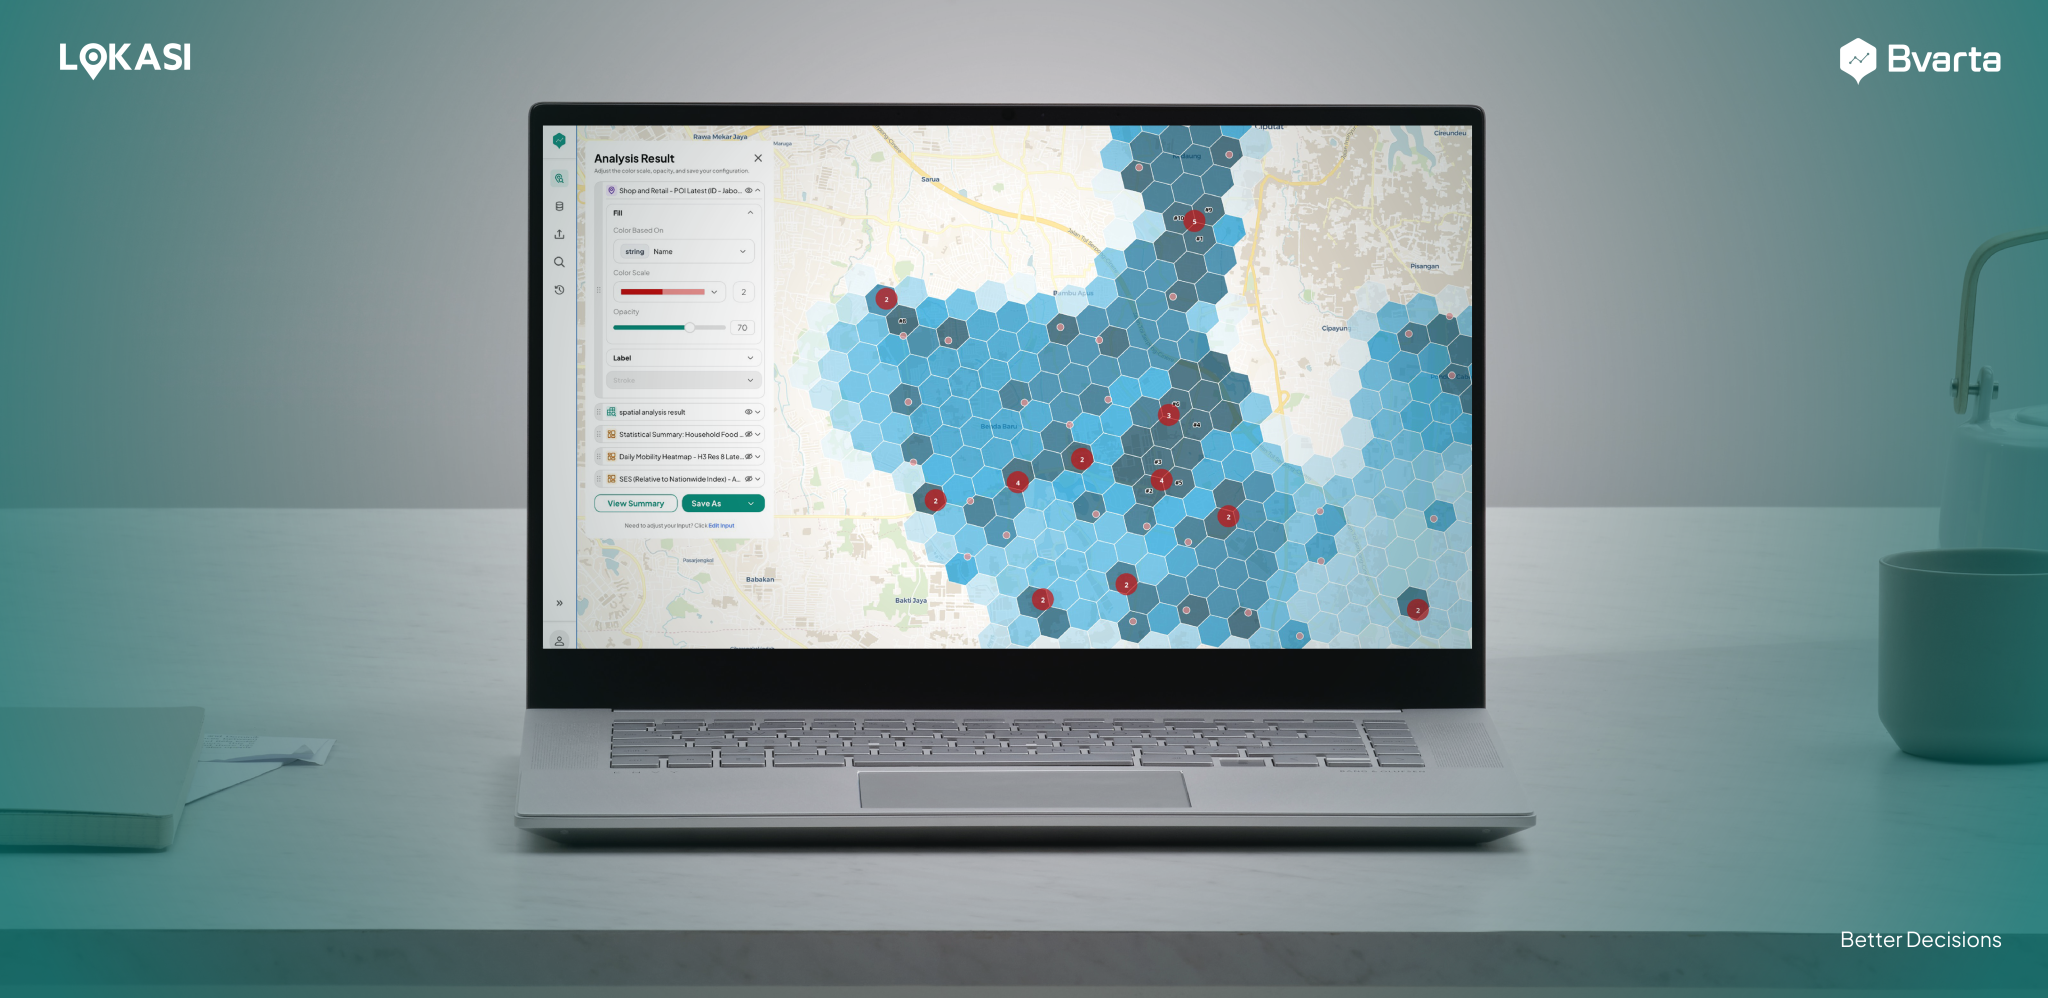
The BSD City study is academic in origin, but its workflow mirrors how leading retailers now make expansion decisions: map demand first, model capture second, then validate against the variables proven to drive performance. The output is not a vague recommendation. It is a ranked list of sites, each with a defined trade area, an estimated market share, and a demographic profile of its captive market. This is exactly the kind of analysis a location intelligence platform is built to operationalize. With LOKASI Intelligence, retail teams can generate demand heat maps from population and point of interest data, delineate trade areas with drive time isochrones, and compare candidate sites side by side, all without assembling a GIS team from scratch. What took a research project months can become a repeatable step in your expansion playbook.Conclusion
The BSD City study proves a simple point: profitable retail locations are not found by intuition, they are calculated. A demand surface map shows where consumers concentrate. The Huff Model estimates how much of that demand a new store can realistically capture. And performance regression reveals which location factors, from proximity to housing clusters to trip generator variety and road access, separate thriving stores from struggling ones. For retailers eyeing BSD City or any fast growing township, the lesson travels well. Map demand before scouting sites. Model capture before signing a lease. Validate every shortlist against the variables proven to move sales. Do that consistently, and expansion stops being a gamble and becomes a repeatable, data backed process. Planning your next store opening, or auditing why an existing one underperforms? Talk to our team about how LOKASI Intelligence can map your market. Reach us on WhatsApp at 0877 7907 7750.
Frequently Asked Questions
What is GIS based retail site selection?
It is the practice of using Geographic Information Systems to combine spatial data layers, such as population density, road networks, points of interest, and competitor locations, to identify and rank the best locations for new retail stores objectively.What is a retail gap zone or white space?
A retail gap zone is an area with high consumer demand but little or no modern retail coverage. In the BSD City study, white space was defined as high demand zones with no modern store within a 600 meter radius.How does the Huff Model help retailers?
The Huff Model estimates the probability that consumers from a given area will shop at a specific store, based on store attractiveness and travel distance. Retailers use it to forecast market share and delineate trade areas before committing to a site.Which location factors matter most for minimarket performance?
Based on the South Tangerang analysis, the strongest predictors were distance to the nearest housing cluster, the variety of trip generators within 500 meters, and collector road density within 300 meters.Can this analysis be done without building an in-house GIS team?
Yes. Location intelligence platforms such as LOKASI Intelligence package demand mapping, trade area analysis, and site scoring into ready to use workflows, so business teams can run the analysis directly.References
Jazma, R. N. A. (2026). Analisis spasial pemilihan lokasi optimal gerai ritel modern dan pemetaan potensi captive market di kawasan BSD City, Tangerang Selatan. Universitas Gadjah Mada. Roig-Tierno, N., Baviera-Puig, A., Buitrago-Vera, J., & Mas-Verdu, F. (2013). The retail site location decision process using GIS and the analytical hierarchy process. Applied Geography, 40, 191–198. https://doi.org/10.1016/j.apgeog.2013.03.005 Seong, E. Y., Lim, Y., & Choi, C. G. (2022). Why are convenience stores clustered? The reasons behind the clustering of similar shops and the effect of increased competition. Environment and Planning B: Urban Analytics and City Science, 49(3), 834–846. https://doi.org/10.1177/23998083211021870