
Shelf placement is one of those things in FMCG that everyone knows matters but few brands approach as strategically as they should. Most trade marketing decisions still come down to which retailer offers the better deal, who has the stronger relationship, or which category manager happens to be accessible.
That is not nothing. Relationships matter in trade. But in a market where shelf space is increasingly contested and shopper attention is scarce, the brands that win are the ones that can back their placement requests with real consumer data. That is where demographic and mobility data come in.
Contents
- 1 The Same Shelf Is Not the Same Everywhere
- 2 What Demographic Data Tells You About Shelf Relevance
- 3 What Mobility Data Adds
- 4 Modern Trade vs. Traditional Trade: Different Rules
- 5 How to Start
- 6 From Reactive to Strategic
- 7 FAQ
- 7.1 Which demographic data points are most useful for FMCG shelf placement?
- 7.2 How is mobility data different from standard foot traffic data?
- 7.3 Can this approach be applied to traditional trade, not just modern trade?
- 7.4 How many outlets do you need to map before you start seeing useful patterns?
- 8 References
The Same Shelf Is Not the Same Everywhere
Here is something that often gets overlooked: the same product can perform very differently depending on where it is placed, not just within a store, but across different store locations entirely.
A convenience store near an office tower serves a different shopper than the same chain’s outlet near a university campus. A minimarket in an upper-middle-class residential area moves different SKUs than one in a working-class neighborhood. The shelf layout, product mix, and promotional focus should reflect these differences.
But how do you know what the right mix is for each location? That is where demographic and mobility data give you an edge.
What Demographic Data Tells You About Shelf Relevance
Demographic data (income levels, age distribution, household composition, lifestyle segment) tells you who is realistically shopping at any given outlet.
For FMCG brands, that has direct implications for shelf strategy:
- Which SKU size to lead with: smaller packs tend to perform better in lower-income or high-transient areas; larger packs do well in family-oriented residential zones.
- Which variant to push: premium variants make more sense in high-income catchments; value lines suit price-sensitive demographics.
- How to frame your trade pitch: a retailer in an upscale commercial district will respond very differently to a margin conversation than one serving daily-wage workers.
Without demographic context, you end up proposing the same shelf strategy across very different consumer realities. And then wondering why results vary so much outlet to outlet.
What Mobility Data Adds
Mobility data adds another layer: it tells you not just who lives near a store, but who actually moves through it and when.
This matters because the shopper profile of an outlet can differ significantly from the demographics of the surrounding area. A minimarket in a business district might see office workers in the morning, college students in the evening, and weekend shoppers from nearby apartments on weekends. Each segment has different purchase behavior.
Mobility data helps you understand:
- Peak visit hours: and therefore when promotional visibility matters most.
- Visitor origin: whether shoppers are locals, commuters, or passing traffic.
- Visit frequency: regular shoppers behave very differently from one-time visitors.
- Competitor cross-shopping: whether your shopper is comparing options before making a decision.
With this information, your trade marketing team can make much more targeted decisions about where to fight hard for premium placement and where a lighter footprint is sufficient.
Modern Trade vs. Traditional Trade: Different Rules
One of the most consequential decisions in FMCG shelf strategy is how to allocate effort between modern trade and traditional trade.
Modern trade is generally easier to work with: structured data, clear planograms, standardized terms. But traditional trade, which in Indonesia accounts for a substantial proportion of total FMCG volume, is far more fragmented and relationship-dependent. Research comparing traditional traders with supermarket expansion in Indonesia found that the decline traditional traders experience is driven less by supermarkets directly and more by internal structural issues and competition from informal street vendors, meaning a one-size-fits-all “modern trade will win” assumption does not hold up well in practice (Suryadarma, Poesoro, Akhmadi, Budiyati, Rosfadhila, & Suryahadi, 2010).
This is exactly where location and demographic data make the biggest difference. By mapping traditional trade outlet density against consumer demographic clusters, FMCG brands can identify which warung-dense areas have the right shopper profile for their product, and direct distributor and sales rep effort accordingly. It turns what is often a spray-and-pray approach into something far more targeted.
How to Start
You do not need to overhaul everything at once. A focused pilot works well:
- Pick a region: one city or area where you want to improve shelf performance.
- Map your outlet universe: overlaid against demographic and mobility layers.
- Segment by consumer profile: not just by channel or geography.
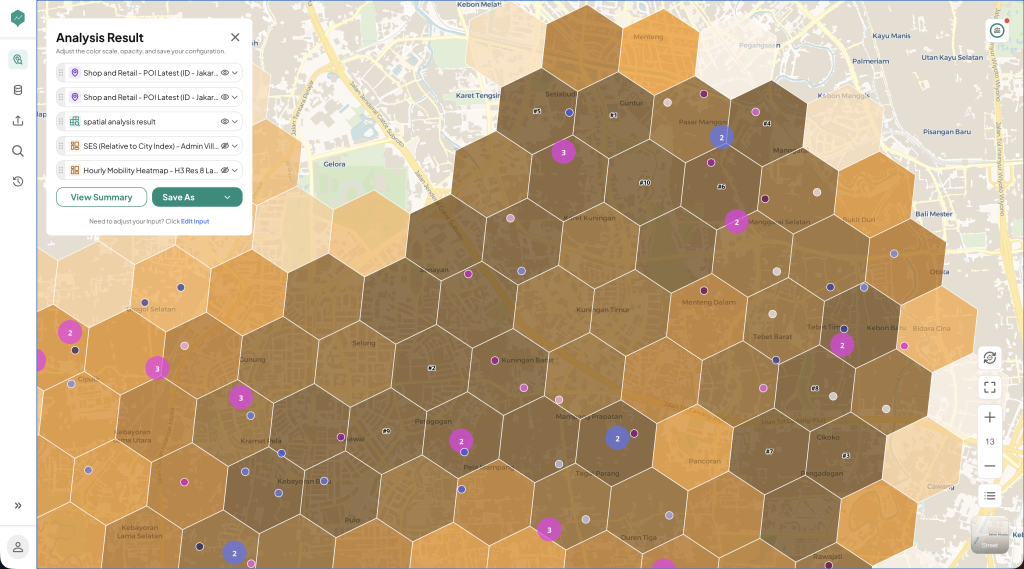 Figure 1: An analysis combining outlet location, socioeconomic segmentation, and mobility patterns reveals how consumer profiles vary block by block, even within outlets that are just a few hundred meters apart.
- Adjust SKU and placement priorities by segment.
- Measure over a quarter: and compare against a control group.
The result is a shelf strategy grounded in who is actually shopping, not just where stores happen to be located.
From Reactive to Strategic
Shelf placement has long been a reactive discipline: you respond to what retailers ask for, negotiate on trade terms, and hope the product ends up visible. Data changes that dynamic.
When you can walk into a category review and say the demographic profile of shoppers in this cluster tells us our 200ml SKU should be at eye level here, and mobility data shows peak purchase windows between 7 and 9 AM, that is a fundamentally different conversation than showing up with a standard planogram deck.
Demographic and mobility data give your trade marketing team the language to be strategic rather than transactional. In a category where shelf space is finite and competition is intense, that difference matters more than most people realize.
FAQ
Which demographic data points are most useful for FMCG shelf placement?
Household income level, age distribution, family size, and lifestyle segmentation are the most commonly used. Together they help determine which SKUs are most relevant per area: whether a given cluster of outlets should be prioritized for premium variants or value lines, and which pack sizes are most likely to sell through.
How is mobility data different from standard foot traffic data?
Foot traffic data measures how many people pass a point. Mobility data is richer: it shows where those people came from, where they go next, how often they visit, and when activity peaks. For FMCG trade marketing, this is especially useful for timing promotional activations, prioritizing sales visits, and making more informed SKU placement decisions.
Can this approach be applied to traditional trade, not just modern trade?
Absolutely, and it is one of the most underutilized applications. Mapping traditional trade outlet density against consumer demographic clusters lets FMCG brands identify which small stores have the shopper profile that best fits their product, and then prioritize distribution and promotional effort accordingly.
How many outlets do you need to map before you start seeing useful patterns?
The broader the coverage, the more reliable the patterns. A practical entry point is one city or region as a pilot: map the full outlet universe, overlay demographic and mobility data, and meaningful segmentation patterns typically emerge within one to two months of analysis.
References
Suryadarma, D., Poesoro, A., Akhmadi, Budiyati, S., Rosfadhila, M., & Suryahadi, A. (2010). Traditional food traders in developing countries and competition from supermarkets: Evidence from Indonesia. Food Policy, 35(1), 79–86. https://doi.org/10.1016/j.foodpol.2009.11.002